

Search for Indicators
Education & Lifelong Learning
Learning allows everyone to be productive citizens, self-sufficient and ready for life. Respect for and access to all types of educational opportunities throughout life equips us with the ability to learn, realize earning potential, think, and to access information in order to make effective decisions, while enriching our understanding of our diverse world.
Graduating from high school, higher education and formal training, imply necessary skills for employment and better opportunities, social responsibility and economic self-sufficiency.
Staying in school is more important as the world and workforce become more complex. WCSD high school graduation rates have improved and continue to be higher than the state. The official graduation rates are reported by the Nevada Department of Education, and are reported via the Annual Reports of Accountability for the previous school year.
Graduation:
In 2015, following adoption of new Nevada Academic Content Standards (including common core state standards), the Washoe County School District began assessing students in grades 3-8 using the Smarter Balanced assessment—criterion referenced, computer-based tests that measure student knowledge of Nevada’s English language arts/literacy (ELA) and mathematics standards.
A scale score is the student’s overall numerical score on a continuous scale (from approximately 2000-3000) that increases across grade levels, used to illustrate students’ current level of achievement and their growth over time. When combined together across a student population, scale scores can also describe school- and district-level changes in performance, as well as reveal gaps in achievement among different groups of students. Based on their scale scores, students fall into one of 4 categories of performance called achievement levels defined by specifications for what knowledge and skills students display at each level:
- Level 4 = The student has exceeded the achievement standard and demonstrates advanced progress toward mastery of the knowledge and skills needed for likely success in future coursework.
- Level 3 = The student has met the achievement standard and demonstrates progress toward mastery of the knowledge and skills needed for likely success in future coursework.
- Level 2 = The student has nearly met the achievement standard and may require further development to demonstrate the knowledge and skills needed for likely success in future coursework.
- Level 1 = The student has not met the achievement standard and needs substantial improvement to demonstrate the knowledge and skills needed for likely success in future coursework.
As college debt becomes higher, university student retention may become harder.
The graduation rate for higher education in Nevada is a percentage of the number of students entering the institutions as undergraduate full-time, first-time, degree-seekers in a cohort year who complete their program within 150% of normal time (6 years for bachelor’s degrees, 3 years for associate’s degrees, 1.5 years for certificates).
Educational Infrastructure & Community Involvement
Enrollment, technology and specialized needs signify access to educational opportunities to be ready for life; while parental and community involvement enhance the student learning experience.
Graduating Functional literacy, GED completion, college-readiness, quality libraries and needed technology are some of the keys to helping individuals participate as responsible citizens and realize their fullest potential.
Indicator Gauge Icon Legend
Legend Colors
Red is bad, green is good, blue is not statistically different/neutral.
Compared to Distribution
 the value is in the best half of communities.
 the value is in the 2nd worst quarter of communities.
 the value is in the worst quarter of communities.
Compared to Target
 meets target;
  does not meet target.
Compared to a Single Value
 lower than the comparison value;
 higher than the comparison value;
 not statistically different from comparison value.
Trend

 non-significant change over time;
 significant change over time;
  no change over time.
Compared to Prior Value
 higher than the previous measurement period;
 lower than the previous measurement period;
 no statistically different change from previous measurement period.
Education / Childcare & Early Childhood Education
Child Care Centers County: Washoe
Child Care Centers County: Washoe
0.3
Per 1,000 population under age 5
(2022)
Compared to:

NV Value
(2.9)
The regional value is compared to the Nevada State value.
US Value
(7.0)
The regional value is compared to the national value.
Prior Value
(0.3)
Prior Value compares a measured value with the previously measured value. Confidence intervals were not taken into account in determining the direction of the comparison.
Education / Childcare & Early Childhood Education
Day Care Center and Preschool Spending-to-Income Ratio
Value
Compared to:
Day Care Center and Preschool Spending-to-Income Ratio County: Washoe
Day Care Center and Preschool Spending-to-Income Ratio County: Washoe
6.9%
(2023)
Compared to:
NV Counties
The distribution is based on data from 17 locales.
U.S. Counties
The distribution is based on data from 3,141 U.S. counties and county equivalents.
NV Value
(7.9%)
The regional value is compared to the Nevada State value.
Prior Value
(6.9%)
Prior Value compares a measured value with the previously measured value. Confidence intervals were not taken into account in determining the direction of the comparison.
Education / Childcare & Early Childhood Education
Home Child Care Spending-to-Income Ratio
Value
Compared to:
Home Child Care Spending-to-Income Ratio County: Washoe
Home Child Care Spending-to-Income Ratio County: Washoe
3.1%
(2023)
Compared to:

NV Counties
The distribution is based on data from 17 locales.
U.S. Counties
The distribution is based on data from 3,141 U.S. counties and county equivalents.
NV Value
(3.3%)
The regional value is compared to the Nevada State value.
Prior Value
(3.1%)
Prior Value compares a measured value with the previously measured value. Confidence intervals were not taken into account in determining the direction of the comparison.
Price of Licensed Child Care County: Washoe
Price of Licensed Child Care County: Washoe
$8,874
(2022)
Compared to:

Prior Value
($9,181)
Prior Value compares a measured value with the previously measured value. Confidence intervals were not taken into account in determining the direction of the comparison.
Trend
This comparison measures the indicator’s values over multiple time periods.<br>The Mann-Kendall Test for Statistical Significance is used to evaluate the trend<br>over 4 to 10 periods of measure, subject to data availability and comparability.
Education / Educational Attainment
College Tuition Spending-to-Income Ratio County: Washoe
College Tuition Spending-to-Income Ratio County: Washoe
11.4%
(2023)
Compared to:
NV Counties
The distribution is based on data from 17 locales.
U.S. Counties
The distribution is based on data from 3,141 U.S. counties and county equivalents.
NV Value
(12.2%)
The regional value is compared to the Nevada State value.
Prior Value
(11.4%)
Prior Value compares a measured value with the previously measured value. Confidence intervals were not taken into account in determining the direction of the comparison.
Community Spending on Education County: Washoe
Community Spending on Education County: Washoe
2.4%
(2023)
Compared to:

NV Value
(2.1%)
The regional value is compared to the Nevada State value.
US Value
(2.4%)
The regional value is compared to the national value.
Prior Value
(2.4%)
Prior Value compares a measured value with the previously measured value. Confidence intervals were not taken into account in determining the direction of the comparison.
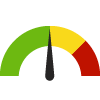
People 25+ with a Bachelor's Degree or Higher County: Washoe
People 25+ with a Bachelor's Degree or Higher County: Washoe
32.5%
(2018-2022)
Compared to:

NV Counties
The distribution is based on data from 17 locales.
U.S. Counties
The distribution is based on data from 3,133 U.S. counties and county equivalents.
NV Value
(26.5%)
The regional value is compared to the Nevada State value.
US Value
(34.3%)
The regional value is compared to the national value.
Trend
This comparison measures the indicator’s values over multiple time periods.<br>The Mann-Kendall Test for Statistical Significance is used to evaluate the trend<br>over 4 to 10 periods of measure, subject to data availability and comparability.
Education / Educational Attainment
People 25+ with a High School Diploma or Higher
Value
Compared to:
People 25+ with a High School Diploma or Higher County: Washoe
People 25+ with a High School Diploma or Higher County: Washoe
88.5%
(2018-2022)
Compared to:
NV Counties
The distribution is based on data from 17 locales.
U.S. Counties
The distribution is based on data from 3,133 U.S. counties and county equivalents.
NV Value
(87.1%)
The regional value is compared to the Nevada State value.
US Value
(89.1%)
The regional value is compared to the national value.
Trend
This comparison measures the indicator’s values over multiple time periods.<br>The Mann-Kendall Test for Statistical Significance is used to evaluate the trend<br>over 4 to 10 periods of measure, subject to data availability and comparability.
Student Loan Spending-to-Income Ratio County: Washoe
Student Loan Spending-to-Income Ratio County: Washoe
4.0%
(2023)
Compared to:

NV Counties
The distribution is based on data from 17 locales.
U.S. Counties
The distribution is based on data from 3,141 U.S. counties and county equivalents.
NV Value
(5.0%)
The regional value is compared to the Nevada State value.
Prior Value
(4.0%)
Prior Value compares a measured value with the previously measured value. Confidence intervals were not taken into account in determining the direction of the comparison.
Veterans with a Bachelor's Degree or Higher County: Washoe
Veterans with a Bachelor's Degree or Higher County: Washoe
31.1%
(2018-2022)
Compared to:
NV Counties
The distribution is based on data from 17 locales.
NV Value
(28.5%)
The regional value is compared to the Nevada State value.
US Value
(30.5%)
The regional value is compared to the national value.
Trend
This comparison measures the indicator’s values over multiple time periods.<br>The Mann-Kendall Test for Statistical Significance is used to evaluate the trend<br>over 4 to 10 periods of measure, subject to data availability and comparability.
Veterans with a High School Diploma or Higher County: Washoe
Veterans with a High School Diploma or Higher County: Washoe
96.6%
(2018-2022)
Compared to:
NV Counties
The distribution is based on data from 17 locales.
U.S. Counties
The distribution is based on data from 3,132 U.S. counties and county equivalents.
NV Value
(95.8%)
The regional value is compared to the Nevada State value.
US Value
(95.0%)
The regional value is compared to the national value.
Trend
This comparison measures the indicator’s values over multiple time periods.<br>The Mann-Kendall Test for Statistical Significance is used to evaluate the trend<br>over 4 to 10 periods of measure, subject to data availability and comparability.
Education / Educational Attainment
Vocational, Technical, and Other School Tuition Spending-to-Income Ratio
Value
Compared to:
Vocational, Technical, and Other School Tuition Spending-to-Income Ratio County: Washoe
Vocational, Technical, and Other School Tuition Spending-to-Income Ratio County: Washoe
1.4%
(2023)
Compared to:
NV Counties
The distribution is based on data from 17 locales.
U.S. Counties
The distribution is based on data from 3,141 U.S. counties and county equivalents.
NV Value
(1.7%)
The regional value is compared to the Nevada State value.
Prior Value
(1.4%)
Prior Value compares a measured value with the previously measured value. Confidence intervals were not taken into account in determining the direction of the comparison.
Education / Literacy
Library System Collection Turnover County: Washoe
Library System Collection Turnover County: Washoe
4.1
Per volumes in collection
(2023)
Compared to:
Prior Value
(3.6)
Prior Value compares a measured value with the previously measured value. Confidence intervals were not taken into account in determining the direction of the comparison.
Trend
This comparison measures the indicator’s values over multiple time periods.<br>The Mann-Kendall Test for Statistical Significance is used to evaluate the trend<br>over 4 to 10 periods of measure, subject to data availability and comparability.
Library System Patron Visitors Per Capita County: Washoe
Library System Patron Visitors Per Capita County: Washoe
1.3
Per capita
(2023)
Compared to:

Prior Value
(1.1)
Prior Value compares a measured value with the previously measured value. Confidence intervals were not taken into account in determining the direction of the comparison.
Trend
This comparison measures the indicator’s values over multiple time periods.<br>The Mann-Kendall Test for Statistical Significance is used to evaluate the trend<br>over 4 to 10 periods of measure, subject to data availability and comparability.
Education / Literacy
Washoe County School District Graduates Completing Nevada System of Higher Education Remedial Coursework
Value
Compared to:
Washoe County School District Graduates Completing Nevada System of Higher Education Remedial Coursework County: Washoe
Washoe County School District Graduates Completing Nevada System of Higher Education Remedial Coursework County: Washoe
40.2%
Percentage of WCSD graduates
(2023)
Compared to:
Prior Value
(41.2%)
Prior Value compares a measured value with the previously measured value. Confidence intervals were not taken into account in determining the direction of the comparison.
Trend
This comparison measures the indicator’s values over multiple time periods.<br>The Mann-Kendall Test for Statistical Significance is used to evaluate the trend<br>over 4 to 10 periods of measure, subject to data availability and comparability.
Education / School Environment
Children in Transition (CIT) Count County: Washoe
Children in Transition (CIT) Count County: Washoe
2,026
Count of WCSD students without permanent housing during the school year
(2023)
Compared to:

Prior Value
(1,950)
Prior Value compares a measured value with the previously measured value. Confidence intervals were not taken into account in determining the direction of the comparison.
Trend
This comparison measures the indicator’s values over multiple time periods.<br>The Mann-Kendall Test for Statistical Significance is used to evaluate the trend<br>over 4 to 10 periods of measure, subject to data availability and comparability.
Education / School Environment
High School Students who have been Electronically Bullied
Value
Compared to:
High School Students who have been Electronically Bullied County: Washoe
High School Students who have been Electronically Bullied County: Washoe
18.6%
(2021)
Compared to:

NV Value
(14.9%)
The regional value is compared to the Nevada State value.
Prior Value
(15.0%)
Prior Value compares a measured value with the previously measured value. Confidence intervals were not taken into account in determining the direction of the comparison.
Trend
This comparison measures the indicator’s values over multiple time periods.<br>The Mann-Kendall Test for Statistical Significance is used to evaluate the trend<br>over 4 to 10 periods of measure, subject to data availability and comparability.
Student-to-Teacher Ratio County: Washoe
Student-to-Teacher Ratio County: Washoe
21.0
Students per teacher
(2022-2023)
Compared to:

NV Counties
The distribution is based on data from 17 locales.
U.S. Counties
The distribution is based on data from 3,125 U.S. counties and county equivalents.
NV Value
(21.0)
The regional value is compared to the Nevada State value.
US Value
(15.4)
The regional value is compared to the national value.
Prior Value
(15.9)
Prior Value compares a measured value with the previously measured value. Confidence intervals were not taken into account in determining the direction of the comparison.
Trend
This comparison measures the indicator’s values over multiple time periods.<br>The Mann-Kendall Test for Statistical Significance is used to evaluate the trend<br>over 4 to 10 periods of measure, subject to data availability and comparability.
Students Who are English Learners County: Washoe
Students Who are English Learners County: Washoe
14.5%
(2022-2023)
Compared to:


NV Value
(13.5%)
The regional value is compared to the Nevada State value.
Prior Value
(14.4%)
Prior Value compares a measured value with the previously measured value. Confidence intervals were not taken into account in determining the direction of the comparison.
Trend
This comparison measures the indicator’s values over multiple time periods.<br>The Mann-Kendall Test for Statistical Significance is used to evaluate the trend<br>over 4 to 10 periods of measure, subject to data availability and comparability.
Students with an Individual Education Program County: Washoe
Students with an Individual Education Program County: Washoe
14.5%
(2022-2023)
Compared to:

NV Value
(12.9%)
The regional value is compared to the Nevada State value.
Prior Value
(14.1%)
Prior Value compares a measured value with the previously measured value. Confidence intervals were not taken into account in determining the direction of the comparison.
Trend
This comparison measures the indicator’s values over multiple time periods.<br>The Mann-Kendall Test for Statistical Significance is used to evaluate the trend<br>over 4 to 10 periods of measure, subject to data availability and comparability.
Education / School Environment
Washoe County School District GASB 34 Government Activity Instruction-only Expenditure Dollars
Value
Compared to:
Washoe County School District GASB 34 Government Activity Instruction-only Expenditure Dollars County: Washoe
Washoe County School District GASB 34 Government Activity Instruction-only Expenditure Dollars County: Washoe
$524,500,035
WCSD government activity instruction-only dollars
(2023)
Compared to:
Prior Value
($386,990,505)
Prior Value compares a measured value with the previously measured value. Confidence intervals were not taken into account in determining the direction of the comparison.
Trend
This comparison measures the indicator’s values over multiple time periods.<br>The Mann-Kendall Test for Statistical Significance is used to evaluate the trend<br>over 4 to 10 periods of measure, subject to data availability and comparability.
Education / School Environment
Washoe County School District GASB 34 Guidelines Activity Total Expenditure Dollars
Value
Compared to:
Washoe County School District GASB 34 Guidelines Activity Total Expenditure Dollars County: Washoe
Washoe County School District GASB 34 Guidelines Activity Total Expenditure Dollars County: Washoe
$852,250,970
WCSD government activities-only dollars
(2023)
Compared to:
Prior Value
($719,872,780)
Prior Value compares a measured value with the previously measured value. Confidence intervals were not taken into account in determining the direction of the comparison.
Trend
This comparison measures the indicator’s values over multiple time periods.<br>The Mann-Kendall Test for Statistical Significance is used to evaluate the trend<br>over 4 to 10 periods of measure, subject to data availability and comparability.
Education / School Environment
Washoe County School District Operating Statistics: Enrollment
Value
Compared to:
Washoe County School District Operating Statistics: Enrollment County: Washoe
Washoe County School District Operating Statistics: Enrollment County: Washoe
60,650
WCSD student enrollment
(2023)
Compared to:


Prior Value
(62,353)
Prior Value compares a measured value with the previously measured value. Confidence intervals were not taken into account in determining the direction of the comparison.
Trend
This comparison measures the indicator’s values over multiple time periods.<br>The Mann-Kendall Test for Statistical Significance is used to evaluate the trend<br>over 4 to 10 periods of measure, subject to data availability and comparability.
Education / School Environment
Washoe County School District Per-Pupil Expenditures
Value
Compared to:
Washoe County School District Per-Pupil Expenditures County: Washoe
Washoe County School District Per-Pupil Expenditures County: Washoe
$10,827
WCSD expenditure dollars
(2022-2023)
Compared to:
Prior Value
($10,220)
Prior Value compares a measured value with the previously measured value. Confidence intervals were not taken into account in determining the direction of the comparison.
Trend
This comparison measures the indicator’s values over multiple time periods.<br>The Mann-Kendall Test for Statistical Significance is used to evaluate the trend<br>over 4 to 10 periods of measure, subject to data availability and comparability.
Washoe County School District Population County: Washoe
Washoe County School District Population County: Washoe
61,171
WCSD student enrollment
(2023)
Compared to:
Prior Value
(62,540)
Prior Value compares a measured value with the previously measured value. Confidence intervals were not taken into account in determining the direction of the comparison.
Trend
This comparison measures the indicator’s values over multiple time periods.<br>The Mann-Kendall Test for Statistical Significance is used to evaluate the trend<br>over 4 to 10 periods of measure, subject to data availability and comparability.
Education / School Environment
WCSD Operating Statistics: Primary Government Cost Per Pupil
Value
Compared to:
WCSD Operating Statistics: Primary Government Cost Per Pupil County: Washoe
WCSD Operating Statistics: Primary Government Cost Per Pupil County: Washoe
$11,361
(2023)
Compared to:
Prior Value
($10,807)
Prior Value compares a measured value with the previously measured value. Confidence intervals were not taken into account in determining the direction of the comparison.
Trend
This comparison measures the indicator’s values over multiple time periods.<br>The Mann-Kendall Test for Statistical Significance is used to evaluate the trend<br>over 4 to 10 periods of measure, subject to data availability and comparability.
Education / School Environment
WCSD Operating Statistics: Primary Government Pupil to Teacher Ratio
Value
Compared to:
WCSD Operating Statistics: Primary Government Pupil to Teacher Ratio County: Washoe
WCSD Operating Statistics: Primary Government Pupil to Teacher Ratio County: Washoe
16.8
Ratio of pupils to teacher
(2023)
Compared to:
Prior Value
(18.8)
Prior Value compares a measured value with the previously measured value. Confidence intervals were not taken into account in determining the direction of the comparison.
Trend
This comparison measures the indicator’s values over multiple time periods.<br>The Mann-Kendall Test for Statistical Significance is used to evaluate the trend<br>over 4 to 10 periods of measure, subject to data availability and comparability.
Education / School Environment
WCSD Operating Statistics: Students Receiving Free or Reduced-Price Meals
Value
Compared to:
WCSD Operating Statistics: Students Receiving Free or Reduced-Price Meals County: Washoe
WCSD Operating Statistics: Students Receiving Free or Reduced-Price Meals County: Washoe
50.9%
Percentage
(2023)
Compared to:

Prior Value
(51.0%)
Prior Value compares a measured value with the previously measured value. Confidence intervals were not taken into account in determining the direction of the comparison.
Trend
This comparison measures the indicator’s values over multiple time periods.<br>The Mann-Kendall Test for Statistical Significance is used to evaluate the trend<br>over 4 to 10 periods of measure, subject to data availability and comparability.
Education / Student Performance K-12
4th Grade Students Proficient in Math County: Washoe
4th Grade Students Proficient in Math County: Washoe
39.8%
(2021-2022)
Compared to:
NV Counties
(2018-2019)
The distribution is based on data from 16 locales.
NV Value
(34.9%)
The regional value is compared to the Nevada State value.
Prior Value
(37.1%)
Prior Value compares a measured value with the previously measured value. Confidence intervals were not taken into account in determining the direction of the comparison.
Trend
This comparison measures the indicator’s values over multiple time periods.<br>The Mann-Kendall Test for Statistical Significance is used to evaluate the trend<br>over 4 to 10 periods of measure, subject to data availability and comparability.
4th Grade Students Proficient in Reading County: Washoe
4th Grade Students Proficient in Reading County: Washoe
46.1%
(2021-2022)
Compared to:
NV Counties
(2020-2021)
The distribution is based on data from 16 locales.
NV Value
(42.7%)
The regional value is compared to the Nevada State value.
Prior Value
(44.1%)
Prior Value compares a measured value with the previously measured value. Confidence intervals were not taken into account in determining the direction of the comparison.
Trend
This comparison measures the indicator’s values over multiple time periods.<br>The Mann-Kendall Test for Statistical Significance is used to evaluate the trend<br>over 4 to 10 periods of measure, subject to data availability and comparability.
8th Grade Students Proficient in Math County: Washoe
8th Grade Students Proficient in Math County: Washoe
25.1%
(2021-2022)
Compared to:

NV Counties
(2018-2019)
The distribution is based on data from 17 locales.
NV Value
(22.2%)
The regional value is compared to the Nevada State value.
Prior Value
(23.6%)
Prior Value compares a measured value with the previously measured value. Confidence intervals were not taken into account in determining the direction of the comparison.
Trend
This comparison measures the indicator’s values over multiple time periods.<br>The Mann-Kendall Test for Statistical Significance is used to evaluate the trend<br>over 4 to 10 periods of measure, subject to data availability and comparability.
8th Grade Students Proficient in Reading County: Washoe
8th Grade Students Proficient in Reading County: Washoe
44.0%
(2021-2022)
Compared to:

NV Counties
(2020-2021)
The distribution is based on data from 16 locales.
NV Value
(42.9%)
The regional value is compared to the Nevada State value.
Prior Value
(45.6%)
Prior Value compares a measured value with the previously measured value. Confidence intervals were not taken into account in determining the direction of the comparison.
Trend
This comparison measures the indicator’s values over multiple time periods.<br>The Mann-Kendall Test for Statistical Significance is used to evaluate the trend<br>over 4 to 10 periods of measure, subject to data availability and comparability.
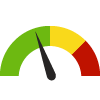
High School Graduation County: Washoe
High School Graduation County: Washoe
81.4%
(2022-2023)
Compared to:

NV Counties
The distribution is based on data from 17 locales.
NV Value
(81.4%)
The regional value is compared to the Nevada State value.
US Value
(86.5% in 2020)
The regional value is compared to the national value. The source for the national value is National Center for Education Statistics
Prior Value
(84.4%)
Prior Value compares a measured value with the previously measured value. Confidence intervals were not taken into account in determining the direction of the comparison.
Trend
This comparison measures the indicator’s values over multiple time periods.<br>The Mann-Kendall Test for Statistical Significance is used to evaluate the trend<br>over 4 to 10 periods of measure, subject to data availability and comparability.
HP 2030 Target
(90.7%)
Education / Student Performance K-12
Students Proficient in English Language Arts (CRT): Grades 3-8
Value
Compared to:
Students Proficient in English Language Arts (CRT): Grades 3-8 County: Washoe
Students Proficient in English Language Arts (CRT): Grades 3-8 County: Washoe
41.2%
(2022-2023)
Compared to:
NV Value
(41.0%)
The regional value is compared to the Nevada State value.
Prior Value
(45.4%)
Prior Value compares a measured value with the previously measured value. Confidence intervals were not taken into account in determining the direction of the comparison.
Trend
This comparison measures the indicator’s values over multiple time periods.<br>The Mann-Kendall Test for Statistical Significance is used to evaluate the trend<br>over 4 to 10 periods of measure, subject to data availability and comparability.
Education / Student Performance K-12
Students Proficient in Math (CRT): Grades 3-8
Value
Compared to:
Students Proficient in Math (CRT): Grades 3-8 County: Washoe
Students Proficient in Math (CRT): Grades 3-8 County: Washoe
33.6%
(2022-2023)
Compared to:
NV Value
(31.3%)
The regional value is compared to the Nevada State value.
Prior Value
(33.6%)
Prior Value compares a measured value with the previously measured value. Confidence intervals were not taken into account in determining the direction of the comparison.
Trend
This comparison measures the indicator’s values over multiple time periods.<br>The Mann-Kendall Test for Statistical Significance is used to evaluate the trend<br>over 4 to 10 periods of measure, subject to data availability and comparability.
