

Search for Indicators
Public Safety & Wellbeing
Safe and secure individuals and families, shelter, neighborhoods, schools and workplaces not only influence overall health and economic development, but also vibrant tourism encouraging visitors to enjoy regional attractions. The community accepts and exercises responsibility to care for its most vulnerable populations, and ensures that others are provided opportunities to achieve sustainable lives.
The "feeling of safety" can have more of an impact on an individual's daily life than reported crime rates, allowing seniors to be more self-sufficient in safe neighborhoods, students to focus on learning in safe schools, employees to travel safely to work and be more productive, and families to feel safe in their homes.
Victims of domestic violence cross racial and ethnic, socio-economic and gender lines.
While only about a third of all crime is reported, the Crime Index is the most commonly used measure of crime and is a consistent sample that allows for national comparisons.
Schools should be safe havens where the focus is on education. Monitoring violence ensures that schools remain safe learning environments. There is a great deal of community concern that serious situations have become more common in recent years, in part, because of media attention.
Limited income, homelessness and food insecurity indicate that assistance may be needed for individuals and families regardless of age, gender, socio-economics, or other racial and ethnic diversity, including effective programs to improve self-sufficiency and life outcomes for all peoples.
Indicator Gauge Icon Legend
Legend Colors
Red is bad, green is good, blue is not statistically different/neutral.
Compared to Distribution
 the value is in the best half of communities.
 the value is in the 2nd worst quarter of communities.
 the value is in the worst quarter of communities.
Compared to Target
 meets target;
  does not meet target.
Compared to a Single Value
 lower than the comparison value;
 higher than the comparison value;
 not statistically different from comparison value.
Trend

 non-significant change over time;
 significant change over time;
  no change over time.
Compared to Prior Value
 higher than the previous measurement period;
 lower than the previous measurement period;
 no statistically different change from previous measurement period.
PUBLIC SAFETY
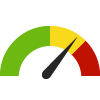
Crime Index County: Washoe
Crime Index County: Washoe
28.0
Rate per 1,000 population
(2023)
Compared to:


NV Value
(30.2)
The regional value is compared to the Nevada State value.
US Value
(23.4 in 2022)
The regional value is compared to the national value.
Prior Value
(27.5)
Prior Value compares a measured value with the previously measured value. Confidence intervals were not taken into account in determining the direction of the comparison.
Trend
This comparison measures the indicator’s values over multiple time periods.<br>The Mann-Kendall Test for Statistical Significance is used to evaluate the trend<br>over 4 to 10 periods of measure, subject to data availability and comparability.
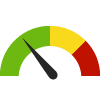
High School Students who have been Electronically Bullied County: Washoe
High School Students who have been Electronically Bullied County: Washoe
18.6%
(2021)
Compared to:

NV Value
(14.9%)
The regional value is compared to the Nevada State value.
Prior Value
(15.0%)
Prior Value compares a measured value with the previously measured value. Confidence intervals were not taken into account in determining the direction of the comparison.
Trend
This comparison measures the indicator’s values over multiple time periods.<br>The Mann-Kendall Test for Statistical Significance is used to evaluate the trend<br>over 4 to 10 periods of measure, subject to data availability and comparability.
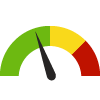
Elder Abuse Crime Rate County: Washoe
Elder Abuse Crime Rate County: Washoe
3.5
Rate per 1,000 population
(2023)
Compared to:
NV Value
(2.3)
The regional value is compared to the Nevada State value.
Prior Value
(3.7)
Prior Value compares a measured value with the previously measured value. Confidence intervals were not taken into account in determining the direction of the comparison.
Trend
This comparison measures the indicator’s values over multiple time periods.<br>The Mann-Kendall Test for Statistical Significance is used to evaluate the trend<br>over 4 to 10 periods of measure, subject to data availability and comparability.
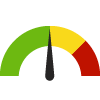
Domestic Violence Crime Rate County: Washoe
Domestic Violence Crime Rate County: Washoe
7.2
Rate per 1,000 population
(2023)
Compared to:
NV Value
(9.7)
The regional value is compared to the Nevada State value.
Prior Value
(7.3)
Prior Value compares a measured value with the previously measured value. Confidence intervals were not taken into account in determining the direction of the comparison.
Trend
This comparison measures the indicator’s values over multiple time periods.<br>The Mann-Kendall Test for Statistical Significance is used to evaluate the trend<br>over 4 to 10 periods of measure, subject to data availability and comparability.
Alcohol-Impaired Driving Deaths County: Washoe
Alcohol-Impaired Driving Deaths County: Washoe
32.2%
Percent of driving deaths with alcohol involvement
(2017-2021)
Compared to:
NV Counties
The distribution is based on data from 17 locales.
U.S. Counties
The distribution is based on data from 3,116 U.S. counties and county equivalents.
NV Value
(27.6%)
The regional value is compared to the Nevada State value.
US Value
(26.3%)
The regional value is compared to the national value.
Prior Value
(37.2%)
Prior Value compares a measured value with the previously measured value. Confidence intervals were taken into account in determining the direction of the comparison.
Trend
This comparison measures the indicator’s values over multiple time periods.<br>The Mann-Kendall Test for Statistical Significance is used to evaluate the trend<br>over 4 to 10 periods of measure, subject to data availability and comparability.
Age-Adjusted Death Rate due to Motor Vehicle Traffic Collisions County: Washoe
Age-Adjusted Death Rate due to Motor Vehicle Traffic Collisions County: Washoe
10.7
Deaths per 100,000 population
(2018-2020)
Compared to:
U.S. Counties
The distribution is based on data from 1,266 U.S. counties and county equivalents.
NV Value
(10.3)
The regional value is compared to the Nevada State value.
US Value
(11.4)
The regional value is compared to the national value.
Prior Value
(9.8)
Prior Value compares a measured value with the previously measured value. Confidence intervals were taken into account in determining the direction of the comparison.
Trend
This comparison measures the indicator’s values over multiple time periods.<br>The Mann-Kendall Test for Statistical Significance is used to evaluate the trend<br>over 4 to 10 periods of measure, subject to data availability and comparability.
HP 2030 Target
(10.1)
Age-Adjusted Death Rate due to Homicide County: Washoe
Age-Adjusted Death Rate due to Homicide County: Washoe
5.2
Deaths per 100,000 population
(2018-2020)
Compared to:
U.S. Counties
The distribution is based on data from 495 U.S. counties and county equivalents.
NV Value
(6.8)
The regional value is compared to the Nevada State value.
US Value
(6.6)
The regional value is compared to the national value.
Prior Value
(4.6)
Prior Value compares a measured value with the previously measured value. Confidence intervals were taken into account in determining the direction of the comparison.
Trend
This comparison measures the indicator’s values over multiple time periods.<br>The Mann-Kendall Test for Statistical Significance is used to evaluate the trend<br>over 4 to 10 periods of measure, subject to data availability and comparability.
HP 2030 Target
(5.5)
<div>IVP-09: Reduce homicides <strong>(LEADING HEALTH INDICATOR)</strong></div>
Age-adjusted Unintentional Injury Mortality Rate County: Washoe
Age-adjusted Unintentional Injury Mortality Rate County: Washoe
68.4
Deaths per 100,000 population
(2020)
Compared to:
NV Value
(53.5)
The regional value is compared to the Nevada State value.
US Value
(57.6)
The regional value is compared to the national value.
Prior Value
(59.2)
Prior Value compares a measured value with the previously measured value. Confidence intervals were not taken into account in determining the direction of the comparison.
Trend
This comparison measures the indicator’s values over multiple time periods.<br>The Mann-Kendall Test for Statistical Significance is used to evaluate the trend<br>over 4 to 10 periods of measure, subject to data availability and comparability.
HP 2030 Target
(43.2)
Age-Adjusted Death Rate due to Firearms County: Washoe
Age-Adjusted Death Rate due to Firearms County: Washoe
14.5
Deaths per 100,000 population
(2018-2020)
Compared to:
U.S. Counties
The distribution is based on data from 1,083 U.S. counties and county equivalents.
NV Value
(15.9)
The regional value is compared to the Nevada State value.
US Value
(12.0)
The regional value is compared to the national value.
Prior Value
(14.7)
Prior Value compares a measured value with the previously measured value. Confidence intervals were taken into account in determining the direction of the comparison.
Trend
This comparison measures the indicator’s values over multiple time periods.<br>The Mann-Kendall Test for Statistical Significance is used to evaluate the trend<br>over 4 to 10 periods of measure, subject to data availability and comparability.
HP 2030 Target
(10.7)
Addressing Safety Along the Truckee River County: Washoe
Addressing Safety Along the Truckee River County: Washoe
85.3%
(2022)
Compared to:
Community Target
(100%)
CHILD SAFETY
Child Abuse Removal Rate County: Washoe
Child Abuse Removal Rate County: Washoe
2.5
Rate per 1,000 children
(2023)
Compared to:
NV Value
(3.8)
The regional value is compared to the Nevada State value.
Prior Value
(2.8)
Prior Value compares a measured value with the previously measured value. Confidence intervals were not taken into account in determining the direction of the comparison.
Trend
This comparison measures the indicator’s values over multiple time periods.<br>The Mann-Kendall Test for Statistical Significance is used to evaluate the trend<br>over 4 to 10 periods of measure, subject to data availability and comparability.
Day Care Center and Preschool Spending-to-Income Ratio County: Washoe
Day Care Center and Preschool Spending-to-Income Ratio County: Washoe
6.9%
(2023)
Compared to:
NV Counties
The distribution is based on data from 17 locales.
U.S. Counties
The distribution is based on data from 3,141 U.S. counties and county equivalents.
NV Value
(7.9%)
The regional value is compared to the Nevada State value.
Prior Value
(6.9%)
Prior Value compares a measured value with the previously measured value. Confidence intervals were not taken into account in determining the direction of the comparison.
Price of Licensed Child Care County: Washoe
Price of Licensed Child Care County: Washoe
$8,874
(2022)
Compared to:
Prior Value
($9,181)
Prior Value compares a measured value with the previously measured value. Confidence intervals were not taken into account in determining the direction of the comparison.
Trend
This comparison measures the indicator’s values over multiple time periods.<br>The Mann-Kendall Test for Statistical Significance is used to evaluate the trend<br>over 4 to 10 periods of measure, subject to data availability and comparability.
Children in Transition (CIT) Count County: Washoe
Children in Transition (CIT) Count County: Washoe
2,026
Count of WCSD students without permanent housing during the school year
(2023)
Compared to:
Prior Value
(1,950)
Prior Value compares a measured value with the previously measured value. Confidence intervals were not taken into account in determining the direction of the comparison.
Trend
This comparison measures the indicator’s values over multiple time periods.<br>The Mann-Kendall Test for Statistical Significance is used to evaluate the trend<br>over 4 to 10 periods of measure, subject to data availability and comparability.
Child Abuse County: Washoe
Child Abuse County: Washoe
6,088
Number of referrals per reports received
(2023)
Compared to:
Prior Value
(7,173)
Prior Value compares a measured value with the previously measured value. Confidence intervals were not taken into account in determining the direction of the comparison.
Trend
This comparison measures the indicator’s values over multiple time periods.<br>The Mann-Kendall Test for Statistical Significance is used to evaluate the trend<br>over 4 to 10 periods of measure, subject to data availability and comparability.
Child Abuse and Neglect Substantiated Reports County: Washoe
Child Abuse and Neglect Substantiated Reports County: Washoe
33.6%
Percent (%) substantiated reports
(2023)
Compared to:
NV Value
(26.8%)
The regional value is compared to the Nevada State value.
US Value
(23.2% in 2010)
The regional value is compared to the national value.
Prior Value
(30.3%)
Prior Value compares a measured value with the previously measured value. Confidence intervals were not taken into account in determining the direction of the comparison.
Trend
This comparison measures the indicator’s values over multiple time periods.<br>The Mann-Kendall Test for Statistical Significance is used to evaluate the trend<br>over 4 to 10 periods of measure, subject to data availability and comparability.
WELLNESS & RECREATION OPPORTUNITIES
Access to Exercise Opportunities County: Washoe
Access to Exercise Opportunities County: Washoe
88.7%
(2024)
Compared to:

NV Counties
The distribution is based on data from 16 locales.
U.S. Counties
The distribution is based on data from 3,096 U.S. counties and county equivalents.
NV Value
(90.6%)
The regional value is compared to the Nevada State value.
US Value
(84.1%)
The regional value is compared to the national value.
Prior Value
(88.3%)
Prior Value compares a measured value with the previously measured value. Confidence intervals were not taken into account in determining the direction of the comparison.
WELLNESS & RECREATION OPPORTUNITIES
Community Doing More for the Health and Safety of the Truckee River
Value
Compared to:
Community Doing More for the Health and Safety of the Truckee River County: Washoe
Community Doing More for the Health and Safety of the Truckee River County: Washoe
96.4%
(2022)
Compared to:
Community Target
(100%)
Park Acreage Rate County: Washoe
Park Acreage Rate County: Washoe
3.79
Park acreage rate per 1,000 population
(2023)
Compared to:


Prior Value
(3.87)
Prior Value compares a measured value with the previously measured value. Confidence intervals were not taken into account in determining the direction of the comparison.
Trend
This comparison measures the indicator’s values over multiple time periods.<br>The Mann-Kendall Test for Statistical Significance is used to evaluate the trend<br>over 4 to 10 periods of measure, subject to data availability and comparability.
Parks and Playgrounds County: Washoe
Parks and Playgrounds County: Washoe
94
Number of parks and playgrounds
(2023)
Compared to:
Prior Value
(94)
Prior Value compares a measured value with the previously measured value. Confidence intervals were not taken into account in determining the direction of the comparison.
Trend
This comparison measures the indicator’s values over multiple time periods.<br>The Mann-Kendall Test for Statistical Significance is used to evaluate the trend<br>over 4 to 10 periods of measure, subject to data availability and comparability.
WELLNESS & RECREATION OPPORTUNITIES
People Spending Time at Parks Along the Truckee River
Value
Compared to:
People Spending Time at Parks Along the Truckee River County: Washoe
People Spending Time at Parks Along the Truckee River County: Washoe
80.2%
(2022)
Compared to:
Community Target
(100%)
FOOD SECURITY
Food Insecurity Rate County: Washoe
Food Insecurity Rate County: Washoe
9.7%
(2021)
Compared to:
NV Counties
The distribution is based on data from 17 locales.
U.S. Counties
The distribution is based on data from 3,140 U.S. counties and county equivalents.
NV Value
(13.0%)
The regional value is compared to the Nevada State value.
US Value
(10.4%)
The regional value is compared to the national value.
Prior Value
(11.2%)
Prior Value compares a measured value with the previously measured value. Confidence intervals were not taken into account in determining the direction of the comparison.
Trend
This comparison measures the indicator’s values over multiple time periods.<br>The Mann-Kendall Test for Statistical Significance is used to evaluate the trend<br>over 4 to 10 periods of measure, subject to data availability and comparability.
Child Food Insecurity Rate County: Washoe
Child Food Insecurity Rate County: Washoe
11.0%
(2021)
Compared to:
NV Counties
The distribution is based on data from 17 locales.
U.S. Counties
The distribution is based on data from 3,140 U.S. counties and county equivalents.
NV Value
(18.5%)
The regional value is compared to the Nevada State value.
US Value
(12.8%)
The regional value is compared to the national value.
Prior Value
(15.0%)
Prior Value compares a measured value with the previously measured value. Confidence intervals were not taken into account in determining the direction of the comparison.
Trend
This comparison measures the indicator’s values over multiple time periods.<br>The Mann-Kendall Test for Statistical Significance is used to evaluate the trend<br>over 4 to 10 periods of measure, subject to data availability and comparability.
Food Environment Index County: Washoe
Food Environment Index County: Washoe
8.1
(2024)
Compared to:
NV Counties
The distribution is based on data from 17 locales.
U.S. Counties
The distribution is based on data from 3,108 U.S. counties and county equivalents.
NV Value
(6.8)
The regional value is compared to the Nevada State value.
US Value
(7.7)
The regional value is compared to the national value.
Prior Value
(7.8)
Prior Value compares a measured value with the previously measured value. Confidence intervals were not taken into account in determining the direction of the comparison.
Trend
This comparison measures the indicator’s values over multiple time periods.<br>The Mann-Kendall Test for Statistical Significance is used to evaluate the trend<br>over 4 to 10 periods of measure, subject to data availability and comparability.
Community Spending on Food County: Washoe
Community Spending on Food County: Washoe
12.6%
(2023)
Compared to:
NV Value
(12.6%)
The regional value is compared to the Nevada State value.
US Value
(12.6%)
The regional value is compared to the national value.
Prior Value
(12.6%)
Prior Value compares a measured value with the previously measured value. Confidence intervals were not taken into account in determining the direction of the comparison.
Food Insecure Children Likely Ineligible for Assistance County: Washoe
Food Insecure Children Likely Ineligible for Assistance County: Washoe
32%
(2021)
Compared to:

NV Counties
The distribution is based on data from 17 locales.
U.S. Counties
The distribution is based on data from 3,134 U.S. counties and county equivalents.
NV Value
(35%)
The regional value is compared to the Nevada State value.
US Value
(25%)
The regional value is compared to the national value.
Prior Value
(33%)
Prior Value compares a measured value with the previously measured value. Confidence intervals were not taken into account in determining the direction of the comparison.
Trend
This comparison measures the indicator’s values over multiple time periods.<br>The Mann-Kendall Test for Statistical Significance is used to evaluate the trend<br>over 4 to 10 periods of measure, subject to data availability and comparability.
Households Receiving SNAP with Children County: Washoe
Households Receiving SNAP with Children County: Washoe
44.5%
(2018-2022)
Compared to:


NV Value
(48.4%)
The regional value is compared to the Nevada State value.
US Value
(47.9%)
The regional value is compared to the national value.
Trend
This comparison measures the indicator’s values over multiple time periods.<br>The Mann-Kendall Test for Statistical Significance is used to evaluate the trend<br>over 4 to 10 periods of measure, subject to data availability and comparability.
Households Receiving SNAP with Children (Count) County: Washoe
Households Receiving SNAP with Children (Count) County: Washoe
9,001
Households
(2018-2022)
Compared to:

Trend
This comparison measures the indicator’s values over multiple time periods.<br>The Mann-Kendall Test for Statistical Significance is used to evaluate the trend<br>over 4 to 10 periods of measure, subject to data availability and comparability.
