The 2023 Mental Health Index, created by Conduent Healthy Communities Institute, is a measure of socioeconomic and health factors correlated with self-reported poor mental health. The index is part of Conduent's SocioNeeds Index® Suite, which provides analytics around social determinants of health to advance equitable outcomes for a range of topics.
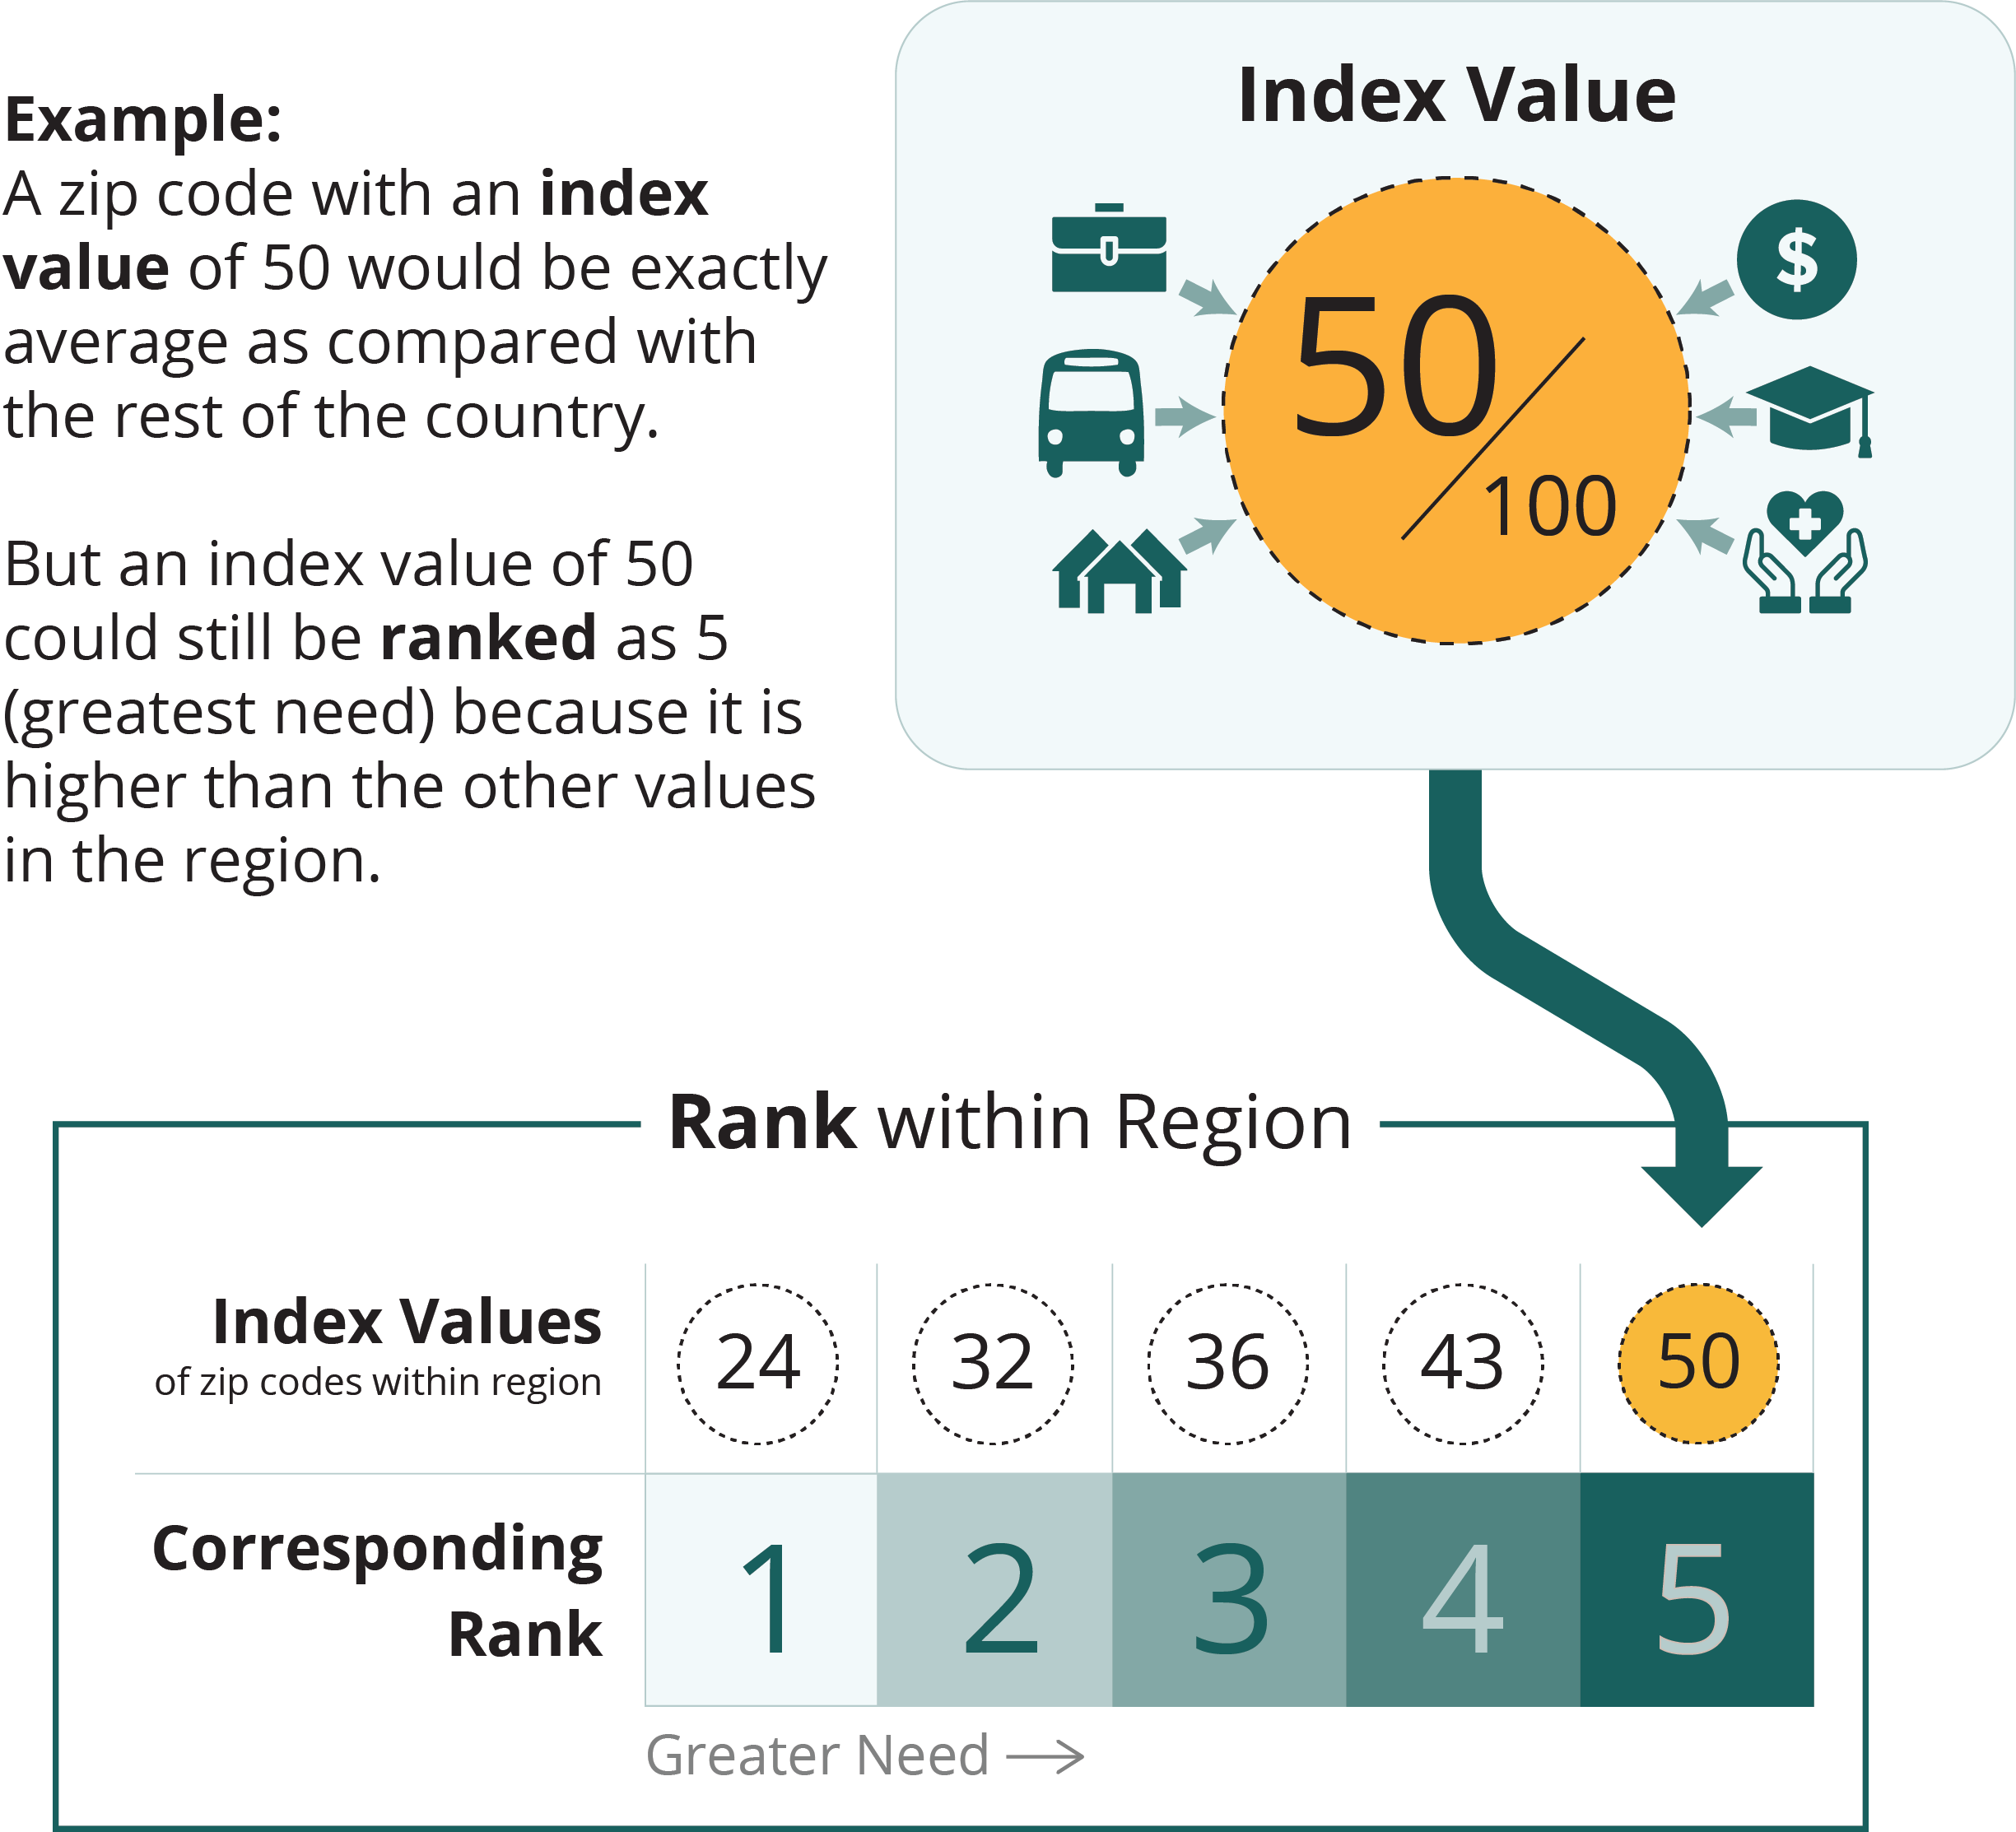
All zip codes, counties, and county equivalents in the United States are given an index value from 0 (low need) to 100 (high need). To help you find the areas of highest need in your community, the selected locations are ranked from 1 (low need) to 5 (high need) based on their index value relative to similar locations within the region.

map legend
greater need
1
2
3
4
5


| Zip Codesort column | Indexsort column | Ranksort column | Pop.sort column | Countysort column |
|---|---|---|---|---|
| 89501 | 93.2 | 5 | 4,614 | Washoe |
| 89512 | 74.0 | 4 | 31,771 | Washoe |
| 89431 | 68.4 | 4 | 41,545 | Washoe |
| 89502 | 65.7 | 4 | 46,998 | Washoe |
| 89434 | 59.1 | 3 | 29,080 | Washoe |
| 89503 | 55.4 | 3 | 29,063 | Washoe |
| 89442 | 55.2 | 3 | 1,015 | Washoe |
| 89509 | 52.0 | 3 | 36,217 | Washoe |
| 89704 | 51.7 | 3 | 4,467 | Washoe |
| 89424 | 51.5 | 3 | 460 | Washoe |
| 89433 | 42.9 | 3 | 22,369 | Washoe |
| 89405 | 39.9 | 2 | 70 | Washoe |
| 89523 | 33.6 | 2 | 37,759 | Washoe |
| 89506 | 31.0 | 2 | 44,886 | Washoe |
| 89436 | 28.1 | 2 | 48,584 | Washoe |
| 89510 | 27.6 | 2 | 2,602 | Washoe |
| 89511 | 25.0 | 2 | 30,234 | Washoe |
| 89521 | 20.4 | 1 | 42,258 | Washoe |
| 89441 | 19.0 | 1 | 14,009 | Washoe |
| 89519 | 17.2 | 1 | 9,866 | Washoe |
| 89439 | 11.2 | 1 | 2,403 | Washoe |
| 89508 | 11.0 | 1 | 13,877 | Washoe |
| 89451 | 6.1 | 1 | 9,804 | Washoe |
Data Source
The Mental Health Index is calculated by Conduent Healthy Communities Institute using data from Claritas, 2023; American Community Survey, 2017-2021; and CDC PLACES Project, 2020.
Technical Note
Index values are not comparable across measurement periods. Index values and rankings are specific to a measurement period, showing the relative ranking of a location in comparison to other similar locations at that time.