

Search for Indicators

Washoe County Senior Quality of Life : Economic Health
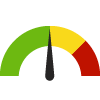
Indicator Gauge Icon Legend
Legend Colors
Red is bad, green is good, blue is not statistically different/neutral.
Compared to Distribution
 the value is in the best half of communities.
 the value is in the 2nd worst quarter of communities.
 the value is in the worst quarter of communities.
Compared to Target
 meets target;
  does not meet target.
Compared to a Single Value
 lower than the comparison value;
 higher than the comparison value;
 not statistically different from comparison value.
Trend

 non-significant change over time;
 significant change over time;
  no change over time.
Compared to Prior Value
 higher than the previous measurement period;
 lower than the previous measurement period;
 no statistically different change from previous measurement period.
 Significantly better than the overall value
 Significantly worse than the overall value
 Significantly different than the overall value
 No significant difference with the overall value
 No data on significance available
HOUSING
Renters Spending 30% or More of Household Income on Rent County: Washoe
Renters Spending 30% or More of Household Income on Rent County: Washoe
49.7%
(2018-2022)
Compared to:


NV Counties
The distribution is based on data from 17 locales.
U.S. Counties
The distribution is based on data from 3,132 U.S. counties and county equivalents.
NV Value
(52.8%)
The regional value is compared to the Nevada State value.
US Value
(49.9%)
The regional value is compared to the national value.
Trend
This comparison measures the indicator’s values over multiple time periods.<br>The Mann-Kendall Test for Statistical Significance is used to evaluate the trend<br>over 4 to 10 periods of measure, subject to data availability and comparability.
HP 2030 Target
(25.5%)
HOUSING
Older Adult Homeowners Spending 30% or More of Household Income on Housing Costs
Value
Compared to:
Older Adult Homeowners Spending 30% or More of Household Income on Housing Costs County: Washoe
Older Adult Homeowners Spending 30% or More of Household Income on Housing Costs County: Washoe
24.9%
(2018-2022)
Compared to:
U.S. Counties
The distribution is based on data from 1,243 U.S. counties and county equivalents.
NV Value
(27.5%)
The regional value is compared to the Nevada State value.
US Value
(25.5%)
The regional value is compared to the national value.
Trend
This comparison measures the indicator’s values over multiple time periods.<br>The Mann-Kendall Test for Statistical Significance is used to evaluate the trend<br>over 4 to 10 periods of measure, subject to data availability and comparability.
Homelessness: Veterans County: Washoe
Homelessness: Veterans County: Washoe
17
Count of unsheltered veterans
(2024)
Compared to:


Prior Value
(15)
Prior Value compares a measured value with the previously measured value. Confidence intervals were not taken into account in determining the direction of the comparison.
Trend
This comparison measures the indicator’s values over multiple time periods.<br>The Mann-Kendall Test for Statistical Significance is used to evaluate the trend<br>over 4 to 10 periods of measure, subject to data availability and comparability.
Subsidized Affordable Housing Inventory County: Washoe
Subsidized Affordable Housing Inventory County: Washoe
17.4
Rate of subsidized affordable housing units per 1,000 population
(2022)
Compared to:


Prior Value
(17.6)
Prior Value compares a measured value with the previously measured value. Confidence intervals were not taken into account in determining the direction of the comparison.
Trend
This comparison measures the indicator’s values over multiple time periods.<br>The Mann-Kendall Test for Statistical Significance is used to evaluate the trend<br>over 4 to 10 periods of measure, subject to data availability and comparability.
Ratio of Assisted Households to Households in Need County: Washoe
Ratio of Assisted Households to Households in Need County: Washoe
30%
Percentage of housing assistance to the need for affordable units
(2022)
Compared to:
Prior Value
(32%)
Prior Value compares a measured value with the previously measured value. Confidence intervals were not taken into account in determining the direction of the comparison.
Trend
This comparison measures the indicator’s values over multiple time periods.<br>The Mann-Kendall Test for Statistical Significance is used to evaluate the trend<br>over 4 to 10 periods of measure, subject to data availability and comparability.
Median Housing Unit Value County: Washoe
Median Housing Unit Value County: Washoe
$460,000
(2018-2022)
Compared to:

NV Counties
The distribution is based on data from 17 locales.
NV Value
($373,800)
The regional value is compared to the Nevada State value.
US Value
($281,900)
The regional value is compared to the national value.
Trend
This comparison measures the indicator’s values over multiple time periods.<br>The Mann-Kendall Test for Statistical Significance is used to evaluate the trend<br>over 4 to 10 periods of measure, subject to data availability and comparability.
POVERTY
People 65+ Living Below Poverty Level County: Washoe
People 65+ Living Below Poverty Level County: Washoe
9.6%
(2018-2022)
Compared to:


NV Counties
The distribution is based on data from 17 locales.
U.S. Counties
The distribution is based on data from 3,133 U.S. counties and county equivalents.
NV Value
(10.1%)
The regional value is compared to the Nevada State value.
US Value
(10.0%)
The regional value is compared to the national value.
Trend
This comparison measures the indicator’s values over multiple time periods.<br>The Mann-Kendall Test for Statistical Significance is used to evaluate the trend<br>over 4 to 10 periods of measure, subject to data availability and comparability.
People 65+ Living Below Poverty Level (Count) County: Washoe
People 65+ Living Below Poverty Level (Count) County: Washoe
7,783
People
(2018-2022)
Compared to:
Trend
This comparison measures the indicator’s values over multiple time periods.<br>The Mann-Kendall Test for Statistical Significance is used to evaluate the trend<br>over 4 to 10 periods of measure, subject to data availability and comparability.
People Living Below Poverty Level County: Washoe
People Living Below Poverty Level County: Washoe
10.9%
(2018-2022)
Compared to:
NV Counties
The distribution is based on data from 17 locales.
U.S. Counties
The distribution is based on data from 3,133 U.S. counties and county equivalents.
NV Value
(12.7%)
The regional value is compared to the Nevada State value.
US Value
(12.5%)
The regional value is compared to the national value.
Trend
This comparison measures the indicator’s values over multiple time periods.<br>The Mann-Kendall Test for Statistical Significance is used to evaluate the trend<br>over 4 to 10 periods of measure, subject to data availability and comparability.
HP 2030 Target
(8.0%)
