

Search for Indicators

Washoe County Senior Quality of Life Safety & Care
Indicator Gauge Icon Legend
Legend Colors
Red is bad, green is good, blue is not statistically different/neutral.
Compared to Distribution
 the value is in the best half of communities.
 the value is in the 2nd worst quarter of communities.
 the value is in the worst quarter of communities.
Compared to Target
 meets target;
  does not meet target.
Compared to a Single Value
 lower than the comparison value;
 higher than the comparison value;
 not statistically different from comparison value.
Trend

 non-significant change over time;
 significant change over time;
  no change over time.
Compared to Prior Value
 higher than the previous measurement period;
 lower than the previous measurement period;
 no statistically different change from previous measurement period.
 Significantly better than the overall value
 Significantly worse than the overall value
 Significantly different than the overall value
 No significant difference with the overall value
 No data on significance available
SAFETY & CARE
People 65+ Living Alone County: Washoe
People 65+ Living Alone County: Washoe
26.2%
(2018-2022)
Compared to:
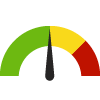

NV Counties
The distribution is based on data from 17 locales.
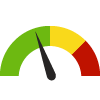
U.S. Counties
The distribution is based on data from 3,133 U.S. counties and county equivalents.
NV Value
(24.3%)
The regional value is compared to the Nevada State value.
US Value
(26.4%)
The regional value is compared to the national value.
Trend
This comparison measures the indicator’s values over multiple time periods.<br>The Mann-Kendall Test for Statistical Significance is used to evaluate the trend<br>over 4 to 10 periods of measure, subject to data availability and comparability.
Adults 65+ with an Independent Living Difficulty County: Washoe
Adults 65+ with an Independent Living Difficulty County: Washoe
12.3%
(2018-2022)
Compared to:


NV Value
(12.9%)
The regional value is compared to the Nevada State value.
US Value
(13.6%)
The regional value is compared to the national value.
Trend
This comparison measures the indicator’s values over multiple time periods.<br>The Mann-Kendall Test for Statistical Significance is used to evaluate the trend<br>over 4 to 10 periods of measure, subject to data availability and comparability.
People 65+ Living Alone (Count) County: Washoe
People 65+ Living Alone (Count) County: Washoe
21,476
People
(2018-2022)
Compared to:

Trend
This comparison measures the indicator’s values over multiple time periods.<br>The Mann-Kendall Test for Statistical Significance is used to evaluate the trend<br>over 4 to 10 periods of measure, subject to data availability and comparability.
Adults 65+ with a Self-Care Difficulty County: Washoe
Adults 65+ with a Self-Care Difficulty County: Washoe
6.2%
(2018-2022)
Compared to:
NV Value
(7.5%)
The regional value is compared to the Nevada State value.
US Value
(7.4%)
The regional value is compared to the national value.
Trend
This comparison measures the indicator’s values over multiple time periods.<br>The Mann-Kendall Test for Statistical Significance is used to evaluate the trend<br>over 4 to 10 periods of measure, subject to data availability and comparability.
Adults 65+ with a Hearing Difficulty County: Washoe
Adults 65+ with a Hearing Difficulty County: Washoe
13.6%
(2018-2022)
Compared to:

NV Value
(14.3%)
The regional value is compared to the Nevada State value.
US Value
(13.7%)
The regional value is compared to the national value.
Trend
This comparison measures the indicator’s values over multiple time periods.<br>The Mann-Kendall Test for Statistical Significance is used to evaluate the trend<br>over 4 to 10 periods of measure, subject to data availability and comparability.
Adults 65+ with a Vision Difficulty County: Washoe
Adults 65+ with a Vision Difficulty County: Washoe
5.6%
(2018-2022)
Compared to:
NV Value
(6.6%)
The regional value is compared to the Nevada State value.
US Value
(6.0%)
The regional value is compared to the national value.
Trend
This comparison measures the indicator’s values over multiple time periods.<br>The Mann-Kendall Test for Statistical Significance is used to evaluate the trend<br>over 4 to 10 periods of measure, subject to data availability and comparability.
