

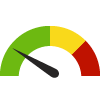
Indicator Gauge Icon Legend
Legend Colors
Red is bad, green is good, blue is not statistically different/neutral.
Compared to Distribution
 the value is in the best half of communities.
 the value is in the 2nd worst quarter of communities.
 the value is in the worst quarter of communities.
Compared to Target
 meets target;
  does not meet target.
Compared to a Single Value
 lower than the comparison value;
 higher than the comparison value;
 not statistically different from comparison value.
Trend

 non-significant change over time;
 significant change over time;
  no change over time.
Compared to Prior Value
 higher than the previous measurement period;
 lower than the previous measurement period;
 no statistically different change from previous measurement period.
 Significantly better than the overall value
 Significantly worse than the overall value
 No significant difference with the overall value
 No data on significance available
Adults Ever Diagnosed with Depression
This indicator is archived and is no longer being updated. Click to learn more
This indicator shows the percentage of adults who report they have been diagnosed with depression.
Why is this important?
According to the Centers for Disease Control and Prevention, depression is a medical illness characterized by persistent sadness and sometimes irritability--particularly in children. Examples of depressive disorders include depression, major depression, dysthymia, and minor depression. There is no singular cause for depressive disorders. Instead, it is likely the result of a combination of genetic and environmental factors. It is often associated with higher risk for mortality from suicide and heart disease, lower workplace productivity and other illnesses such as anxiety disorders, substance abuse, and cancer. Not only can it interfere with an individual's daily functioning, but it can also have negative impacts on the communities they live in. According to the National Institute of Mental Health, major depressive disorder is the leading cause of disability for individuals ages 15-44 in the United States and affects nearly 14.8 million American adults, or about 6.7 percent of the adult population. Although many effective treatment options are available, many individuals who suffer from depression do not have access to treatment or do not seek treatment. Effective treatment for depression is important in order to prevent it from becoming a chronic disease.
19.0%
Source:
CDC - PLACES
Measurement period: 2021
Maintained by: Conduent Healthy Communities Institute
Last update: September 2023
Measurement period: 2021
Maintained by: Conduent Healthy Communities Institute
Last update: September 2023
Filter(s) for this location: State: Nevada
Compared to
Technical note: Sub-county small area estimates use state and county data from the CDC's Behavioral Risk Factor Surveillance System (BRFSS) in tandem with demographic data for census tracts and cities. It is not appropriate to use this data for evaluation purposes.
More details:
Graph Selections

View maps, graphs, and tables for this indicator by selecting other location types (above).
Data Source
- CDC - PLACES
Note: This source uses Zip Code Tabulation Areas (ZCTAs) for its Zip Code data. Learn more
Maintained By: Conduent Healthy Communities Institute (Methodology)
Filed under: Health / Mental Health & Mental Disorders, Health Status, Adults