

Search for Indicators

Health & Wellness
Healthy communities create a healthy economy and self-reliant families. When we invest in preventative measures as a cost-effective way to improve health, everyone takes an active role managing their own health and people have their basic healthcare needs met, including access to a variety of healthcare facilities and services.
This Community Dashboard sponsored by:
When quality medical care is hard to find and needed coverage is still unaffordable, it impacts health outcomes and overall individual, family and community health and economics.
According to America's Health Rankings, Nevada continues to rank near last on per capita state dollars dedicated to public health and federal dollars directed to states per person by the Centers for Disease Control & Prevention and the Health Resources & Services Administration (2-year estimates).
Understanding personal health risks and choices helps the community converge on education and prevention, reducing the high cost of care and treatment for everyone, and the cost to the community in terms of productive lives cut short.
Health data reveals emerging trends and areas in need of new policies or new systems so citizens can live longer, healthier lives increasing productivity and economic prosperity.
TMT tracked the leading cause of death in the past, and although the measure may not be as important as some other heath metrics, the data do act as an early warning sign for certain diseases and associated behaviors. Understanding the causes of death helps residents assess health risks and allows the community to target eduction and prevention resources. Cause of death shows why the community is losing people who still should have productive years ahead of them.
Indicator Gauge Icon Legend
Legend Colors
Red is bad, green is good, blue is not statistically different/neutral.
Compared to Distribution
 the value is in the best half of communities.
 the value is in the 2nd worst quarter of communities.
 the value is in the worst quarter of communities.
Compared to Target
 meets target;
  does not meet target.
Compared to a Single Value
 lower than the comparison value;
 higher than the comparison value;
 not statistically different from comparison value.
Trend

 non-significant change over time;
 significant change over time;
  no change over time.
Compared to Prior Value
 higher than the previous measurement period;
 lower than the previous measurement period;
 no statistically different change from previous measurement period.
Health / Mortality Data
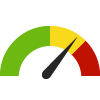
Age-adjusted Unintentional Injury Mortality Rate County: Washoe
Age-adjusted Unintentional Injury Mortality Rate County: Washoe
68.4
Deaths per 100,000 population
(2020)
Compared to:


NV Value
(53.5)
The regional value is compared to the Nevada State value.
US Value
(57.6)
The regional value is compared to the national value.
Prior Value
(59.2)
Prior Value compares a measured value with the previously measured value. Confidence intervals were not taken into account in determining the direction of the comparison.
Trend
This comparison measures the indicator’s values over multiple time periods.<br>The Mann-Kendall Test for Statistical Significance is used to evaluate the trend<br>over 4 to 10 periods of measure, subject to data availability and comparability.
HP 2030 Target
(43.2)
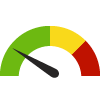
Alcohol-Induced Mortality Rate County: Washoe
Alcohol-Induced Mortality Rate County: Washoe
34.3
Deaths per 100,000 population
(2021)
Compared to:
NV Value
(25.8)
The regional value is compared to the Nevada State value.
US Value
(16.3)
The regional value is compared to the national value.
Prior Value
(28.9)
Prior Value compares a measured value with the previously measured value. Confidence intervals were not taken into account in determining the direction of the comparison.
Trend
This comparison measures the indicator’s values over multiple time periods.<br>The Mann-Kendall Test for Statistical Significance is used to evaluate the trend<br>over 4 to 10 periods of measure, subject to data availability and comparability.
HP 2030 Target
(28.3)
Breast Cancer Mortality Rate County: Washoe
Breast Cancer Mortality Rate County: Washoe
21.4
Deaths per 100,000 females
(2021)
Compared to:
NV Value
(24.9)
The regional value is compared to the Nevada State value.
US Value
(25.4)
The regional value is compared to the national value.
Prior Value
(28.8)
Prior Value compares a measured value with the previously measured value. Confidence intervals were not taken into account in determining the direction of the comparison.
Trend
This comparison measures the indicator’s values over multiple time periods.<br>The Mann-Kendall Test for Statistical Significance is used to evaluate the trend<br>over 4 to 10 periods of measure, subject to data availability and comparability.
HP 2030 Target
(15.3)
Cervical Cancer Mortality Rate County: Washoe
Cervical Cancer Mortality Rate County: Washoe
6.6
Deaths per 100,000 females
(2021)
Compared to:
NV Value
(9.2)
The regional value is compared to the Nevada State value.
US Value
(9.9)
The regional value is compared to the national value.
Prior Value
(10.2)
Prior Value compares a measured value with the previously measured value. Confidence intervals were not taken into account in determining the direction of the comparison.
Trend
This comparison measures the indicator’s values over multiple time periods.<br>The Mann-Kendall Test for Statistical Significance is used to evaluate the trend<br>over 4 to 10 periods of measure, subject to data availability and comparability.
Colorectal Cancer Mortality Rate County: Washoe
Colorectal Cancer Mortality Rate County: Washoe
18.0
Deaths per 100,000 population
(2021)
Compared to:
NV Value
(17.9)
The regional value is compared to the Nevada State value.
US Value
(16.3)
The regional value is compared to the national value.
Prior Value
(11.9)
Prior Value compares a measured value with the previously measured value. Confidence intervals were not taken into account in determining the direction of the comparison.
Trend
This comparison measures the indicator’s values over multiple time periods.<br>The Mann-Kendall Test for Statistical Significance is used to evaluate the trend<br>over 4 to 10 periods of measure, subject to data availability and comparability.
HP 2030 Target
(8.9)
Firearm Fatalities Per 100,000 Population County: Washoe
Firearm Fatalities Per 100,000 Population County: Washoe
20.5
Rate per 100,000 population
(2021)
Compared to:
NV Value
(19.8)
The regional value is compared to the Nevada State value.
US Value
(13.2)
The regional value is compared to the national value.
Prior Value
(15.3)
Prior Value compares a measured value with the previously measured value. Confidence intervals were not taken into account in determining the direction of the comparison.
Trend
This comparison measures the indicator’s values over multiple time periods.<br>The Mann-Kendall Test for Statistical Significance is used to evaluate the trend<br>over 4 to 10 periods of measure, subject to data availability and comparability.
HP 2030 Target
(10.7)
Intentional Injury (Suicide) Mortality Rate County: Washoe
Intentional Injury (Suicide) Mortality Rate County: Washoe
22.7
Deaths per 100,000 population
(2021)
Compared to:
NV Value
(22.0)
The regional value is compared to the Nevada State value.
US Value
(14.5)
The regional value is compared to the national value.
Prior Value
(20.1)
Prior Value compares a measured value with the previously measured value. Confidence intervals were not taken into account in determining the direction of the comparison.
Trend
This comparison measures the indicator’s values over multiple time periods.<br>The Mann-Kendall Test for Statistical Significance is used to evaluate the trend<br>over 4 to 10 periods of measure, subject to data availability and comparability.
HP 2030 Target
(12.8)
Life Expectancy County: Washoe
Life Expectancy County: Washoe
77.3
Years
(2019-2021)
Compared to:

NV Counties
The distribution is based on data from 16 locales.
U.S. Counties
The distribution is based on data from 3,070 U.S. counties and county equivalents.
NV Value
(77.0)
The regional value is compared to the Nevada State value.
US Value
(77.6)
The regional value is compared to the national value.
Lung Cancer Mortality Rate County: Washoe
Lung Cancer Mortality Rate County: Washoe
32.2
Deaths per 100,000 population
(2021)
Compared to:
NV Value
(34.4)
The regional value is compared to the Nevada State value.
US Value
(40.6)
The regional value is compared to the national value.
Prior Value
(34.6)
Prior Value compares a measured value with the previously measured value. Confidence intervals were not taken into account in determining the direction of the comparison.
Trend
This comparison measures the indicator’s values over multiple time periods.<br>The Mann-Kendall Test for Statistical Significance is used to evaluate the trend<br>over 4 to 10 periods of measure, subject to data availability and comparability.
HP 2030 Target
(25.1)
Mortality Rate Among Children: 0-19 Years County: Washoe
Mortality Rate Among Children: 0-19 Years County: Washoe
54.5
Rate per 100,000 population
(2021)
Compared to:
NV Value
(52.3)
The regional value is compared to the Nevada State value.
US Value
(52.5)
The regional value is compared to the national value.
Prior Value
(59.1)
Prior Value compares a measured value with the previously measured value. Confidence intervals were not taken into account in determining the direction of the comparison.
Trend
This comparison measures the indicator’s values over multiple time periods.<br>The Mann-Kendall Test for Statistical Significance is used to evaluate the trend<br>over 4 to 10 periods of measure, subject to data availability and comparability.
Mortality Rate Among Infants: Under 1 Year County: Washoe
Mortality Rate Among Infants: Under 1 Year County: Washoe
6.1
Rate per 1,000 live births
(2021)
Compared to:
NV Value
(5.8)
The regional value is compared to the Nevada State value.
US Value
(5.4)
The regional value is compared to the national value.
Prior Value
(5.9)
Prior Value compares a measured value with the previously measured value. Confidence intervals were not taken into account in determining the direction of the comparison.
Trend
This comparison measures the indicator’s values over multiple time periods.<br>The Mann-Kendall Test for Statistical Significance is used to evaluate the trend<br>over 4 to 10 periods of measure, subject to data availability and comparability.
HP 2030 Target
(5.0)
Mortality Rate for Leading Causes County: Washoe
Mortality Rate for Leading Causes County: Washoe
987.0
Deaths per 100,000 population
(2021)
Compared to:
NV Value
(1,047.2)
The regional value is compared to the Nevada State value.
US Value
(1,043.8)
The regional value is compared to the national value.
Prior Value
(990.8)
Prior Value compares a measured value with the previously measured value. Confidence intervals were not taken into account in determining the direction of the comparison.
Trend
This comparison measures the indicator’s values over multiple time periods.<br>The Mann-Kendall Test for Statistical Significance is used to evaluate the trend<br>over 4 to 10 periods of measure, subject to data availability and comparability.
Motor Vehicle Accident Mortality Rate County: Washoe
Motor Vehicle Accident Mortality Rate County: Washoe
12.2
Deaths per 100,000 population
(2021)
Compared to:
NV Value
(13.0)
The regional value is compared to the Nevada State value.
US Value
(14.2)
The regional value is compared to the national value.
Prior Value
(13.6)
Prior Value compares a measured value with the previously measured value. Confidence intervals were not taken into account in determining the direction of the comparison.
Trend
This comparison measures the indicator’s values over multiple time periods.<br>The Mann-Kendall Test for Statistical Significance is used to evaluate the trend<br>over 4 to 10 periods of measure, subject to data availability and comparability.
HP 2030 Target
(10.1)
Premature Death County: Washoe
Premature Death County: Washoe
8,057.5
Years per 100,000 population
(2019-2021)
Compared to:
U.S. Counties
The distribution is based on data from 2,886 U.S. counties and county equivalents.
NV Value
(8,316.9)
The regional value is compared to the Nevada State value.
US Value
(7,971.5)
The regional value is compared to the national value.
Prescription Drug Related Mortality Rate County: Washoe
Prescription Drug Related Mortality Rate County: Washoe
29.2
Deaths per 100,000 population
(2022)
Compared to:

NV Value
(17.2)
The regional value is compared to the Nevada State value.
Prior Value
(27.0)
Prior Value compares a measured value with the previously measured value. Confidence intervals were not taken into account in determining the direction of the comparison.
Trend
This comparison measures the indicator’s values over multiple time periods.<br>The Mann-Kendall Test for Statistical Significance is used to evaluate the trend<br>over 4 to 10 periods of measure, subject to data availability and comparability.
Prostate Cancer Mortality Rate County: Washoe
Prostate Cancer Mortality Rate County: Washoe
15.6
Deaths per 100,000 males
(2021)
Compared to:
NV Value
(19.9)
The regional value is compared to the Nevada State value.
US Value
(19.8)
The regional value is compared to the national value.
Prior Value
(24.9)
Prior Value compares a measured value with the previously measured value. Confidence intervals were not taken into account in determining the direction of the comparison.
Trend
This comparison measures the indicator’s values over multiple time periods.<br>The Mann-Kendall Test for Statistical Significance is used to evaluate the trend<br>over 4 to 10 periods of measure, subject to data availability and comparability.
HP 2030 Target
(16.9)
Unintentional Injury Mortality Rate County: Washoe
Unintentional Injury Mortality Rate County: Washoe
73.0
Deaths per 100,000 population
(2021)
Compared to:
NV Value
(64.4)
The regional value is compared to the Nevada State value.
US Value
(67.8)
The regional value is compared to the national value.
Prior Value
(71.7)
Prior Value compares a measured value with the previously measured value. Confidence intervals were not taken into account in determining the direction of the comparison.
Trend
This comparison measures the indicator’s values over multiple time periods.<br>The Mann-Kendall Test for Statistical Significance is used to evaluate the trend<br>over 4 to 10 periods of measure, subject to data availability and comparability.
Health / Nutrition & Healthy Eating
Adult Fruit Consumption County: Washoe
Adult Fruit Consumption County: Washoe
57.5%
(2021)
Compared to:


NV Value
(58.1%)
The regional value is compared to the Nevada State value.
Prior Value
(61.4%)
Prior Value compares a measured value with the previously measured value. Confidence intervals were not taken into account in determining the direction of the comparison.
Trend
This comparison measures the indicator’s values over multiple time periods.<br>The Mann-Kendall Test for Statistical Significance is used to evaluate the trend<br>over 4 to 10 periods of measure, subject to data availability and comparability.
Adult Vegetable Consumption County: Washoe
Adult Vegetable Consumption County: Washoe
77.6%
(2021)
Compared to:

NV Value
(76.0%)
The regional value is compared to the Nevada State value.
Prior Value
(78.9%)
Prior Value compares a measured value with the previously measured value. Confidence intervals were not taken into account in determining the direction of the comparison.
Trend
This comparison measures the indicator’s values over multiple time periods.<br>The Mann-Kendall Test for Statistical Significance is used to evaluate the trend<br>over 4 to 10 periods of measure, subject to data availability and comparability.
Community Spending on Food County: Washoe
Community Spending on Food County: Washoe
12.6%
(2023)
Compared to:
NV Value
(12.6%)
The regional value is compared to the Nevada State value.
US Value
(12.6%)
The regional value is compared to the national value.
Prior Value
(12.6%)
Prior Value compares a measured value with the previously measured value. Confidence intervals were not taken into account in determining the direction of the comparison.
Food Environment Index County: Washoe
Food Environment Index County: Washoe
8.1
(2024)
Compared to:
NV Counties
The distribution is based on data from 17 locales.
U.S. Counties
The distribution is based on data from 3,108 U.S. counties and county equivalents.
NV Value
(6.8)
The regional value is compared to the Nevada State value.
US Value
(7.7)
The regional value is compared to the national value.
Prior Value
(7.8)
Prior Value compares a measured value with the previously measured value. Confidence intervals were not taken into account in determining the direction of the comparison.
Trend
This comparison measures the indicator’s values over multiple time periods.<br>The Mann-Kendall Test for Statistical Significance is used to evaluate the trend<br>over 4 to 10 periods of measure, subject to data availability and comparability.
Health / Nutrition & Healthy Eating
High School Students Who Do Not Eat Breakfast
Value
Compared to:
High School Students Who Do Not Eat Breakfast County: Washoe
High School Students Who Do Not Eat Breakfast County: Washoe
76.2
High school students
(2021)
Compared to:
NV Value
(79.1)
The regional value is compared to the Nevada State value.
Prior Value
(71.3)
Prior Value compares a measured value with the previously measured value. Confidence intervals were taken into account in determining the direction of the comparison.
High School Students who Drink Soda or Pop County: Washoe
High School Students who Drink Soda or Pop County: Washoe
14.4%
(2021)
Compared to:
NV Value
(14.0%)
The regional value is compared to the Nevada State value.
Prior Value
(11.2%)
Prior Value compares a measured value with the previously measured value. Confidence intervals were not taken into account in determining the direction of the comparison.
High School Students who Eat Fruit County: Washoe
High School Students who Eat Fruit County: Washoe
32.9%
(2021)
Compared to:
NV Value
(26.6%)
The regional value is compared to the Nevada State value.
Prior Value
(54.3%)
Prior Value compares a measured value with the previously measured value. Confidence intervals were taken into account in determining the direction of the comparison.
Trend
This comparison measures the indicator’s values over multiple time periods.<br>The Mann-Kendall Test for Statistical Significance is used to evaluate the trend<br>over 4 to 10 periods of measure, subject to data availability and comparability.
High School Students who Eat Vegetables County: Washoe
High School Students who Eat Vegetables County: Washoe
31.7%
(2021)
Compared to:
NV Value
(25.2%)
The regional value is compared to the Nevada State value.
Prior Value
(12.8%)
Prior Value compares a measured value with the previously measured value. Confidence intervals were taken into account in determining the direction of the comparison.
Trend
This comparison measures the indicator’s values over multiple time periods.<br>The Mann-Kendall Test for Statistical Significance is used to evaluate the trend<br>over 4 to 10 periods of measure, subject to data availability and comparability.
Health / Older Adults
Adult Day Care Spending-to-Income Ratio County: Washoe
Adult Day Care Spending-to-Income Ratio County: Washoe
11.1%
(2023)
Compared to:
NV Counties
The distribution is based on data from 17 locales.
U.S. Counties
The distribution is based on data from 3,141 U.S. counties and county equivalents.
NV Value
(13.8%)
The regional value is compared to the Nevada State value.
Prior Value
(11.1%)
Prior Value compares a measured value with the previously measured value. Confidence intervals were not taken into account in determining the direction of the comparison.
Health / Older Adults
Adults 65+ who Received Recommended Preventive Services: Females
Value
Compared to:
Adults 65+ who Received Recommended Preventive Services: Females County: Washoe
Adults 65+ who Received Recommended Preventive Services: Females County: Washoe
31.3%
(2020)
Compared to:

NV Counties
The distribution is based on data from 17 locales.
U.S. Counties
The distribution is based on data from 3,141 U.S. counties and county equivalents.
US Value
(37.9%)
The regional value is compared to the national value.
Health / Older Adults
Adults 65+ who Received Recommended Preventive Services: Males
Value
Compared to:
Adults 65+ who Received Recommended Preventive Services: Males County: Washoe
Adults 65+ who Received Recommended Preventive Services: Males County: Washoe
41.7%
(2020)
Compared to:
NV Counties
The distribution is based on data from 17 locales.
U.S. Counties
The distribution is based on data from 3,141 U.S. counties and county equivalents.
US Value
(43.7%)
The regional value is compared to the national value.
Adults 65+ with a Disability County: Washoe
Adults 65+ with a Disability County: Washoe
31.5%
(2018-2022)
Compared to:


NV Value
(34.0%)
The regional value is compared to the Nevada State value.
US Value
(33.3%)
The regional value is compared to the national value.
Trend
This comparison measures the indicator’s values over multiple time periods.<br>The Mann-Kendall Test for Statistical Significance is used to evaluate the trend<br>over 4 to 10 periods of measure, subject to data availability and comparability.
Adults 65+ with a Hearing Difficulty County: Washoe
Adults 65+ with a Hearing Difficulty County: Washoe
13.6%
(2018-2022)
Compared to:

NV Value
(14.3%)
The regional value is compared to the Nevada State value.
US Value
(13.7%)
The regional value is compared to the national value.
Trend
This comparison measures the indicator’s values over multiple time periods.<br>The Mann-Kendall Test for Statistical Significance is used to evaluate the trend<br>over 4 to 10 periods of measure, subject to data availability and comparability.
Adults 65+ with a Self-Care Difficulty County: Washoe
Adults 65+ with a Self-Care Difficulty County: Washoe
6.2%
(2018-2022)
Compared to:

NV Value
(7.5%)
The regional value is compared to the Nevada State value.
US Value
(7.4%)
The regional value is compared to the national value.
Trend
This comparison measures the indicator’s values over multiple time periods.<br>The Mann-Kendall Test for Statistical Significance is used to evaluate the trend<br>over 4 to 10 periods of measure, subject to data availability and comparability.
Adults 65+ with a Vision Difficulty County: Washoe
Adults 65+ with a Vision Difficulty County: Washoe
5.6%
(2018-2022)
Compared to:
NV Value
(6.6%)
The regional value is compared to the Nevada State value.
US Value
(6.0%)
The regional value is compared to the national value.
Trend
This comparison measures the indicator’s values over multiple time periods.<br>The Mann-Kendall Test for Statistical Significance is used to evaluate the trend<br>over 4 to 10 periods of measure, subject to data availability and comparability.
Adults 65+ with an Independent Living Difficulty County: Washoe
Adults 65+ with an Independent Living Difficulty County: Washoe
12.3%
(2018-2022)
Compared to:
NV Value
(12.9%)
The regional value is compared to the Nevada State value.
US Value
(13.6%)
The regional value is compared to the national value.
Trend
This comparison measures the indicator’s values over multiple time periods.<br>The Mann-Kendall Test for Statistical Significance is used to evaluate the trend<br>over 4 to 10 periods of measure, subject to data availability and comparability.
Adults 65+ without Health Insurance County: Washoe
Adults 65+ without Health Insurance County: Washoe
0.7%
(2018-2022)
Compared to:
NV Counties
The distribution is based on data from 17 locales.
U.S. Counties
The distribution is based on data from 3,133 U.S. counties and county equivalents.
NV Value
(1.3%)
The regional value is compared to the Nevada State value.
US Value
(0.8%)
The regional value is compared to the national value.
Trend
This comparison measures the indicator’s values over multiple time periods.<br>The Mann-Kendall Test for Statistical Significance is used to evaluate the trend<br>over 4 to 10 periods of measure, subject to data availability and comparability.
Age-Adjusted Death Rate due to Alzheimer's Disease County: Washoe
Age-Adjusted Death Rate due to Alzheimer's Disease County: Washoe
17.4
Deaths per 100,000 population
(2018-2020)
Compared to:
U.S. Counties
The distribution is based on data from 2,140 U.S. counties and county equivalents.
NV Value
(24.7)
The regional value is compared to the Nevada State value.
US Value
(31.0)
The regional value is compared to the national value.
Prior Value
(20.4)
Prior Value compares a measured value with the previously measured value. Confidence intervals were taken into account in determining the direction of the comparison.
Trend
This comparison measures the indicator’s values over multiple time periods.<br>The Mann-Kendall Test for Statistical Significance is used to evaluate the trend<br>over 4 to 10 periods of measure, subject to data availability and comparability.
Alzheimer's Disease or Dementia: Medicare Population County: Washoe
Alzheimer's Disease or Dementia: Medicare Population County: Washoe
4.0%
(2022)
Compared to:
NV Counties
The distribution is based on data from 17 locales.
U.S. Counties
The distribution is based on data from 3,129 U.S. counties and county equivalents.
NV Value
(5.0%)
The regional value is compared to the Nevada State value.
US Value
(6.0%)
The regional value is compared to the national value.
Prior Value
(4.0%)
Prior Value compares a measured value with the previously measured value. Confidence intervals were not taken into account in determining the direction of the comparison.
Trend
This comparison measures the indicator’s values over multiple time periods.<br>The Mann-Kendall Test for Statistical Significance is used to evaluate the trend<br>over 4 to 10 periods of measure, subject to data availability and comparability.
Median Household Income: Householders 65+ County: Washoe
Median Household Income: Householders 65+ County: Washoe
$64,724
(2018-2022)
Compared to:
NV Counties
The distribution is based on data from 17 locales.
U.S. Counties
The distribution is based on data from 3,133 U.S. counties and county equivalents.
NV Value
($56,049)
The regional value is compared to the Nevada State value.
US Value
($54,699)
The regional value is compared to the national value.
Trend
This comparison measures the indicator’s values over multiple time periods.<br>The Mann-Kendall Test for Statistical Significance is used to evaluate the trend<br>over 4 to 10 periods of measure, subject to data availability and comparability.
Health / Older Adults
Older Adult Homeowners Spending 30% or More of Household Income on Housing Costs
Value
Compared to:
Older Adult Homeowners Spending 30% or More of Household Income on Housing Costs County: Washoe
Older Adult Homeowners Spending 30% or More of Household Income on Housing Costs County: Washoe
24.9%
(2018-2022)
Compared to:
U.S. Counties
The distribution is based on data from 1,243 U.S. counties and county equivalents.
NV Value
(27.5%)
The regional value is compared to the Nevada State value.
US Value
(25.5%)
The regional value is compared to the national value.
Trend
This comparison measures the indicator’s values over multiple time periods.<br>The Mann-Kendall Test for Statistical Significance is used to evaluate the trend<br>over 4 to 10 periods of measure, subject to data availability and comparability.
People 65+ Living Alone County: Washoe
People 65+ Living Alone County: Washoe
26.2%
(2018-2022)
Compared to:
NV Counties
The distribution is based on data from 17 locales.
U.S. Counties
The distribution is based on data from 3,133 U.S. counties and county equivalents.
NV Value
(24.3%)
The regional value is compared to the Nevada State value.
US Value
(26.4%)
The regional value is compared to the national value.
Trend
This comparison measures the indicator’s values over multiple time periods.<br>The Mann-Kendall Test for Statistical Significance is used to evaluate the trend<br>over 4 to 10 periods of measure, subject to data availability and comparability.
People 65+ Living Alone (Count) County: Washoe
People 65+ Living Alone (Count) County: Washoe
21,476
People
(2018-2022)
Compared to:
Trend
This comparison measures the indicator’s values over multiple time periods.<br>The Mann-Kendall Test for Statistical Significance is used to evaluate the trend<br>over 4 to 10 periods of measure, subject to data availability and comparability.
People 65+ Living Below Poverty Level County: Washoe
People 65+ Living Below Poverty Level County: Washoe
9.6%
(2018-2022)
Compared to:
NV Counties
The distribution is based on data from 17 locales.
U.S. Counties
The distribution is based on data from 3,133 U.S. counties and county equivalents.
NV Value
(10.1%)
The regional value is compared to the Nevada State value.
US Value
(10.0%)
The regional value is compared to the national value.
Trend
This comparison measures the indicator’s values over multiple time periods.<br>The Mann-Kendall Test for Statistical Significance is used to evaluate the trend<br>over 4 to 10 periods of measure, subject to data availability and comparability.
People 65+ Living Below Poverty Level (Count) County: Washoe
People 65+ Living Below Poverty Level (Count) County: Washoe
7,783
People
(2018-2022)
Compared to:
Trend
This comparison measures the indicator’s values over multiple time periods.<br>The Mann-Kendall Test for Statistical Significance is used to evaluate the trend<br>over 4 to 10 periods of measure, subject to data availability and comparability.
People who have Difficulty Speaking English: 65+ County: Washoe
People who have Difficulty Speaking English: 65+ County: Washoe
5.5%
(2018-2022)
Compared to:

NV Counties
The distribution is based on data from 17 locales.
U.S. Counties
The distribution is based on data from 3,133 U.S. counties and county equivalents.
NV Value
(10.5%)
The regional value is compared to the Nevada State value.
US Value
(8.6%)
The regional value is compared to the national value.
Trend
This comparison measures the indicator’s values over multiple time periods.<br>The Mann-Kendall Test for Statistical Significance is used to evaluate the trend<br>over 4 to 10 periods of measure, subject to data availability and comparability.
Health / Older Adults
Percentage of Seniors Self-reporting Barriers to Community Participation
Value
Compared to:
Percentage of Seniors Self-reporting Barriers to Community Participation County: Washoe
Percentage of Seniors Self-reporting Barriers to Community Participation County: Washoe
76.5%
Percentage of responses - Reasons why you do not participate in community programs, events, and per or activities or do not participate more often
(2022)
Compared to:
Community Target
(100%)
Percentage of Seniors Self-reporting Feeling Isolated County: Washoe
Percentage of Seniors Self-reporting Feeling Isolated County: Washoe
76.5%
Percentage of responses - How often do you feel isolated from others?
(2022)
Compared to:
Community Target
(100%)
Percentage of Seniors Self-reporting Feeling Left Out County: Washoe
Percentage of Seniors Self-reporting Feeling Left Out County: Washoe
77.1%
Percentage of responses - How often do you feel left out?
(2022)
Compared to:
Community Target
(100%)
Percentage of Seniors Self-reporting Food Insecurity County: Washoe
Percentage of Seniors Self-reporting Food Insecurity County: Washoe
95.5%
Percentage of responses - How often in the past 12 months did you or anyone in your household cut the size of your meal skip meals because there was not enough money for food?
(2022)
Compared to:
Community Target
(100%)
Health / Older Adults
Percentage of Seniors Self-reporting Food Insecurity Cost Issues
Value
Compared to:
Percentage of Seniors Self-reporting Food Insecurity Cost Issues County: Washoe
Percentage of Seniors Self-reporting Food Insecurity Cost Issues County: Washoe
90.9%
Percentage of responses - How often in the past 12 months did you ever have to choose between paying for food and paying for...?
(2022)
Compared to:
Community Target
(100%)
Health / Older Adults
Percentage of Seniors Self-reporting Having a Special Person to Share Feelings
Value
Compared to:
Percentage of Seniors Self-reporting Having a Special Person to Share Feelings County: Washoe
Percentage of Seniors Self-reporting Having a Special Person to Share Feelings County: Washoe
76.0%
Percentage of responses - There is a special person with whom I can share my joys and sorrows
(2022)
Compared to:
Community Target
(100%)
Percentage of Seniors Self-reporting Lacking Companionship County: Washoe
Percentage of Seniors Self-reporting Lacking Companionship County: Washoe
77.1%
Percentage of responses - How often do you feel that you lack companionship?
(2022)
Compared to:
Community Target
(100%)
Health / Older Adults
Percentage of Seniors Self-reporting Social Support When in Need
Value
Compared to:
Percentage of Seniors Self-reporting Social Support When in Need County: Washoe
Percentage of Seniors Self-reporting Social Support When in Need County: Washoe
76.0%
Percentage of responses - There is a special person who is around when I am in need
(2022)
Compared to:
Community Target
(100%)
Health / Oral Health
Adults 65+ with Total Tooth Loss County: Washoe
Adults 65+ with Total Tooth Loss County: Washoe
10.5%
(2020)
Compared to:
NV Counties
The distribution is based on data from 17 locales.
U.S. Counties
The distribution is based on data from 3,141 U.S. counties and county equivalents.
US Value
(13.4%)
The regional value is compared to the national value.
Adults who Visited a Dentist County: Washoe
Adults who Visited a Dentist County: Washoe
64.7%
(2020)
Compared to:
NV Counties
The distribution is based on data from 17 locales.
U.S. Counties
The distribution is based on data from 3,141 U.S. counties and county equivalents.
US Value
(64.8%)
The regional value is compared to the national value.
Dentist Rate County: Washoe
Dentist Rate County: Washoe
71
Dentists per 100,000 population
(2022)
Compared to:
NV Counties
The distribution is based on data from 16 locales.
U.S. Counties
The distribution is based on data from 3,054 U.S. counties and county equivalents.
NV Value
(66)
The regional value is compared to the Nevada State value.
Prior Value
(70)
Prior Value compares a measured value with the previously measured value. Confidence intervals were not taken into account in determining the direction of the comparison.
Trend
This comparison measures the indicator’s values over multiple time periods.<br>The Mann-Kendall Test for Statistical Significance is used to evaluate the trend<br>over 4 to 10 periods of measure, subject to data availability and comparability.
High School Students who Visited a Dentist County: Washoe
High School Students who Visited a Dentist County: Washoe
75.3%
(2021)
Compared to:
NV Value
(67.7%)
The regional value is compared to the Nevada State value.
Prior Value
(74.7%)
Prior Value compares a measured value with the previously measured value. Confidence intervals were not taken into account in determining the direction of the comparison.
Trend
This comparison measures the indicator’s values over multiple time periods.<br>The Mann-Kendall Test for Statistical Significance is used to evaluate the trend<br>over 4 to 10 periods of measure, subject to data availability and comparability.
Middle School Students who Visited a Dentist County: Washoe
Middle School Students who Visited a Dentist County: Washoe
71.0%
(2021)
Compared to:
NV Value
(63.9%)
The regional value is compared to the Nevada State value.
Prior Value
(71.6%)
Prior Value compares a measured value with the previously measured value. Confidence intervals were not taken into account in determining the direction of the comparison.
Trend
This comparison measures the indicator’s values over multiple time periods.<br>The Mann-Kendall Test for Statistical Significance is used to evaluate the trend<br>over 4 to 10 periods of measure, subject to data availability and comparability.
Health / Other Conditions
Adults with Arthritis County: Washoe
Adults with Arthritis County: Washoe
25.5%
(2021)
Compared to:
NV Counties
The distribution is based on data from 17 locales.
U.S. Counties
The distribution is based on data from 3,074 U.S. counties and county equivalents.
US Value
(25.2%)
The regional value is compared to the national value.
Adults with Kidney Disease County: Washoe
Adults with Kidney Disease County: Washoe
3.1%
(2021)
Compared to:
NV Counties
The distribution is based on data from 17 locales.
U.S. Counties
The distribution is based on data from 3,074 U.S. counties and county equivalents.
US Value
(3.1%)
The regional value is compared to the national value.
Age-Adjusted Death Rate due to Kidney Disease County: Washoe
Age-Adjusted Death Rate due to Kidney Disease County: Washoe
9.0
Deaths per 100,000 population
(2018-2020)
Compared to:
U.S. Counties
The distribution is based on data from 1,416 U.S. counties and county equivalents.
NV Value
(8.8)
The regional value is compared to the Nevada State value.
US Value
(12.8)
The regional value is compared to the national value.
Prior Value
(8.1)
Prior Value compares a measured value with the previously measured value. Confidence intervals were taken into account in determining the direction of the comparison.
Trend
This comparison measures the indicator’s values over multiple time periods.<br>The Mann-Kendall Test for Statistical Significance is used to evaluate the trend<br>over 4 to 10 periods of measure, subject to data availability and comparability.
Chronic Kidney Disease: Medicare Population County: Washoe
Chronic Kidney Disease: Medicare Population County: Washoe
15.0%
(2022)
Compared to:
NV Counties
The distribution is based on data from 17 locales.
U.S. Counties
The distribution is based on data from 3,129 U.S. counties and county equivalents.
NV Value
(17.0%)
The regional value is compared to the Nevada State value.
US Value
(18.0%)
The regional value is compared to the national value.
Prior Value
(15.0%)
Prior Value compares a measured value with the previously measured value. Confidence intervals were not taken into account in determining the direction of the comparison.
Trend
This comparison measures the indicator’s values over multiple time periods.<br>The Mann-Kendall Test for Statistical Significance is used to evaluate the trend<br>over 4 to 10 periods of measure, subject to data availability and comparability.
Osteoporosis: Medicare Population County: Washoe
Osteoporosis: Medicare Population County: Washoe
11.0%
(2022)
Compared to:
NV Counties
The distribution is based on data from 17 locales.
U.S. Counties
The distribution is based on data from 3,129 U.S. counties and county equivalents.
NV Value
(10.0%)
The regional value is compared to the Nevada State value.
US Value
(11.0%)
The regional value is compared to the national value.
Prior Value
(10.0%)
Prior Value compares a measured value with the previously measured value. Confidence intervals were not taken into account in determining the direction of the comparison.
Trend
This comparison measures the indicator’s values over multiple time periods.<br>The Mann-Kendall Test for Statistical Significance is used to evaluate the trend<br>over 4 to 10 periods of measure, subject to data availability and comparability.
Health / Other Conditions
Rheumatoid Arthritis or Osteoarthritis: Medicare Population
Value
Compared to:
Rheumatoid Arthritis or Osteoarthritis: Medicare Population County: Washoe
Rheumatoid Arthritis or Osteoarthritis: Medicare Population County: Washoe
31.0%
(2022)
Compared to:
NV Counties
The distribution is based on data from 17 locales.
U.S. Counties
The distribution is based on data from 3,129 U.S. counties and county equivalents.
NV Value
(31.0%)
The regional value is compared to the Nevada State value.
US Value
(35.0%)
The regional value is compared to the national value.
Prior Value
(29.0%)
Prior Value compares a measured value with the previously measured value. Confidence intervals were not taken into account in determining the direction of the comparison.
Trend
This comparison measures the indicator’s values over multiple time periods.<br>The Mann-Kendall Test for Statistical Significance is used to evaluate the trend<br>over 4 to 10 periods of measure, subject to data availability and comparability.
Health / Physical Activity
Access to Exercise Opportunities County: Washoe
Access to Exercise Opportunities County: Washoe
88.7%
(2024)
Compared to:
NV Counties
The distribution is based on data from 16 locales.
U.S. Counties
The distribution is based on data from 3,096 U.S. counties and county equivalents.
NV Value
(90.6%)
The regional value is compared to the Nevada State value.
US Value
(84.1%)
The regional value is compared to the national value.
Prior Value
(88.3%)
Prior Value compares a measured value with the previously measured value. Confidence intervals were not taken into account in determining the direction of the comparison.
Access to Parks County: Washoe
Access to Parks County: Washoe
94.8%
(2020)
Compared to:
NV Counties
The distribution is based on data from 17 locales.
NV Value
(80.7%)
The regional value is compared to the Nevada State value.
Prior Value
(88.8%)
Prior Value compares a measured value with the previously measured value. Confidence intervals were not taken into account in determining the direction of the comparison.
Adults 20+ who are Sedentary County: Washoe
Adults 20+ who are Sedentary County: Washoe
17.5%
(2021)
Compared to:
NV Counties
The distribution is based on data from 17 locales.
U.S. Counties
The distribution is based on data from 3,074 U.S. counties and county equivalents.
Prior Value
(16.6%)
Prior Value compares a measured value with the previously measured value. Confidence intervals were taken into account in determining the direction of the comparison.
Trend
This comparison measures the indicator’s values over multiple time periods.<br>The Mann-Kendall Test for Statistical Significance is used to evaluate the trend<br>over 4 to 10 periods of measure, subject to data availability and comparability.
Adults who meet U.S. Aerobic and Strength Guidelines County: Washoe
Adults who meet U.S. Aerobic and Strength Guidelines County: Washoe
26.7%
(2019)
Compared to:
NV Value
(20.0%)
The regional value is compared to the Nevada State value.
Prior Value
(27.3%)
Prior Value compares a measured value with the previously measured value. Confidence intervals were not taken into account in determining the direction of the comparison.
Trend
This comparison measures the indicator’s values over multiple time periods.<br>The Mann-Kendall Test for Statistical Significance is used to evaluate the trend<br>over 4 to 10 periods of measure, subject to data availability and comparability.
High School Students Who Were Not Physically Active County: Washoe
High School Students Who Were Not Physically Active County: Washoe
52.4
High school students
(2021)
Compared to:
NV Value
(58.7)
The regional value is compared to the Nevada State value.
Prior Value
(54.4)
Prior Value compares a measured value with the previously measured value. Confidence intervals were taken into account in determining the direction of the comparison.
Trend
This comparison measures the indicator’s values over multiple time periods.<br>The Mann-Kendall Test for Statistical Significance is used to evaluate the trend<br>over 4 to 10 periods of measure, subject to data availability and comparability.
Workers who Bike to Work County: Washoe
Workers who Bike to Work County: Washoe
0.4%
(2018-2022)
Compared to:
NV Counties
(2015-2019)
The distribution is based on data from 17 locales.
NV Value
(0.3%)
The regional value is compared to the Nevada State value.
US Value
(0.5%)
The regional value is compared to the national value.
Trend
This comparison measures the indicator’s values over multiple time periods.<br>The Mann-Kendall Test for Statistical Significance is used to evaluate the trend<br>over 4 to 10 periods of measure, subject to data availability and comparability.
Workers who Walk to Work County: Washoe
Workers who Walk to Work County: Washoe
2.0%
(2018-2022)
Compared to:
NV Counties
The distribution is based on data from 17 locales.
U.S. Counties
The distribution is based on data from 3,133 U.S. counties and county equivalents.
NV Value
(1.5%)
The regional value is compared to the Nevada State value.
US Value
(2.4%)
The regional value is compared to the national value.
Trend
This comparison measures the indicator’s values over multiple time periods.<br>The Mann-Kendall Test for Statistical Significance is used to evaluate the trend<br>over 4 to 10 periods of measure, subject to data availability and comparability.
Health / Prevention & Safety
Age-Adjusted Death Rate due to Firearms County: Washoe
Age-Adjusted Death Rate due to Firearms County: Washoe
14.5
Deaths per 100,000 population
(2018-2020)
Compared to:
U.S. Counties
The distribution is based on data from 1,083 U.S. counties and county equivalents.
NV Value
(15.9)
The regional value is compared to the Nevada State value.
US Value
(12.0)
The regional value is compared to the national value.
Prior Value
(14.7)
Prior Value compares a measured value with the previously measured value. Confidence intervals were taken into account in determining the direction of the comparison.
Trend
This comparison measures the indicator’s values over multiple time periods.<br>The Mann-Kendall Test for Statistical Significance is used to evaluate the trend<br>over 4 to 10 periods of measure, subject to data availability and comparability.
HP 2030 Target
(10.7)
Health / Prevention & Safety
Age-Adjusted Death Rate due to Unintentional Injuries
Value
Compared to:
Age-Adjusted Death Rate due to Unintentional Injuries County: Washoe
Age-Adjusted Death Rate due to Unintentional Injuries County: Washoe
60.5
Deaths per 100,000 population
(2018-2020)
Compared to:
U.S. Counties
The distribution is based on data from 2,454 U.S. counties and county equivalents.
NV Value
(48.7)
The regional value is compared to the Nevada State value.
US Value
(51.6)
The regional value is compared to the national value.
Prior Value
(57.0)
Prior Value compares a measured value with the previously measured value. Confidence intervals were taken into account in determining the direction of the comparison.
Trend
This comparison measures the indicator’s values over multiple time periods.<br>The Mann-Kendall Test for Statistical Significance is used to evaluate the trend<br>over 4 to 10 periods of measure, subject to data availability and comparability.
HP 2030 Target
(43.2)
Death Rate due to Injuries County: Washoe
Death Rate due to Injuries County: Washoe
96.5
Deaths per 100,000 population
(2017-2021)
Compared to:
U.S. Counties
The distribution is based on data from 3,037 U.S. counties and county equivalents.
NV Value
(83.7)
The regional value is compared to the Nevada State value.
US Value
(80.0)
The regional value is compared to the national value.
Health / Prevention & Safety
High School Students who have Been Physically Hurt by an Adult
Value
Compared to:
High School Students who have Been Physically Hurt by an Adult County: Washoe
High School Students who have Been Physically Hurt by an Adult County: Washoe
10.9%
(2021)
Compared to:
NV Value
(14.0%)
The regional value is compared to the Nevada State value.
Health / Prevention & Safety
High School Students who have Been Verbally Abused by an Adult
Value
Compared to:
High School Students who have Been Verbally Abused by an Adult County: Washoe
High School Students who have Been Verbally Abused by an Adult County: Washoe
42.2%
(2021)
Compared to:
NV Value
(41.8%)
The regional value is compared to the Nevada State value.
Prior Value
(32.9%)
Prior Value compares a measured value with the previously measured value. Confidence intervals were not taken into account in determining the direction of the comparison.
Health / Prevention & Safety
High School Students who have Seen or Heard Adults in their Home Become Violent
Value
Compared to:
High School Students who have Seen or Heard Adults in their Home Become Violent County: Washoe
High School Students who have Seen or Heard Adults in their Home Become Violent County: Washoe
8.6%
(2021)
Compared to:
NV Value
(8.6%)
The regional value is compared to the Nevada State value.
Health / Prevention & Safety
High School Students who Rode in a Car with a Drunk Driver
Value
Compared to:
High School Students who Rode in a Car with a Drunk Driver County: Washoe
High School Students who Rode in a Car with a Drunk Driver County: Washoe
13.3%
(2021)
Compared to:
NV Value
(13.7%)
The regional value is compared to the Nevada State value.
Prior Value
(17.2%)
Prior Value compares a measured value with the previously measured value. Confidence intervals were not taken into account in determining the direction of the comparison.
Health / Prevention & Safety
High School Students who were ever Forced to have Sexual Intercourse
Value
Compared to:
High School Students who were ever Forced to have Sexual Intercourse County: Washoe
High School Students who were ever Forced to have Sexual Intercourse County: Washoe
7.9%
(2019)
Compared to:
NV Value
(6.2%)
The regional value is compared to the Nevada State value.
Prior Value
(7.6%)
Prior Value compares a measured value with the previously measured value. Confidence intervals were not taken into account in determining the direction of the comparison.
Trend
This comparison measures the indicator’s values over multiple time periods.<br>The Mann-Kendall Test for Statistical Significance is used to evaluate the trend<br>over 4 to 10 periods of measure, subject to data availability and comparability.
Health / Prevention & Safety
Middle School Students who have been Electronically Bullied: Past Year
Value
Compared to:
Middle School Students who have been Electronically Bullied: Past Year County: Washoe
Middle School Students who have been Electronically Bullied: Past Year County: Washoe
17.9%
(2021)
Compared to:
NV Value
(17.7%)
The regional value is compared to the Nevada State value.
Prior Value
(16.8%)
Prior Value compares a measured value with the previously measured value. Confidence intervals were not taken into account in determining the direction of the comparison.
Health / Prevention & Safety
Middle School Students who have Been Physically Hurt by an Adult
Value
Compared to:
Middle School Students who have Been Physically Hurt by an Adult County: Washoe
Middle School Students who have Been Physically Hurt by an Adult County: Washoe
11.1%
(2021)
Compared to:
NV Value
(11.0%)
The regional value is compared to the Nevada State value.
Prior Value
(13.0%)
Prior Value compares a measured value with the previously measured value. Confidence intervals were not taken into account in determining the direction of the comparison.
Health / Prevention & Safety
Middle School Students who have Been Verbally Abused by an Adult
Value
Compared to:
Middle School Students who have Been Verbally Abused by an Adult County: Washoe
Middle School Students who have Been Verbally Abused by an Adult County: Washoe
38.0%
(2021)
Compared to:
NV Value
(31.7%)
The regional value is compared to the Nevada State value.
Health / Prevention & Safety
Middle School Students who Have Ever Rode in a Car with a Drunk Driver
Value
Compared to:
Middle School Students who Have Ever Rode in a Car with a Drunk Driver County: Washoe
Middle School Students who Have Ever Rode in a Car with a Drunk Driver County: Washoe
19.8%
(2021)
Compared to:
NV Value
(18.6%)
The regional value is compared to the Nevada State value.
Prior Value
(24.9%)
Prior Value compares a measured value with the previously measured value. Confidence intervals were not taken into account in determining the direction of the comparison.
Health / Prevention & Safety
Middle School Students who have Seen or Heard Adults in their Home Become Violent
Value
Compared to:
Middle School Students who have Seen or Heard Adults in their Home Become Violent County: Washoe
Middle School Students who have Seen or Heard Adults in their Home Become Violent County: Washoe
13.2%
(2021)
Compared to:
NV Value
(14.3%)
The regional value is compared to the Nevada State value.
Prior Value
(17.0%)
Prior Value compares a measured value with the previously measured value. Confidence intervals were not taken into account in determining the direction of the comparison.
Health / Prevention & Safety
Middle School Students who were ever Forced to have Sexual Intercourse
Value
Compared to:
Middle School Students who were ever Forced to have Sexual Intercourse County: Washoe
Middle School Students who were ever Forced to have Sexual Intercourse County: Washoe
4.1%
(2021)
Compared to:
NV Value
(4.0%)
The regional value is compared to the Nevada State value.
Prior Value
(3.5%)
Prior Value compares a measured value with the previously measured value. Confidence intervals were not taken into account in determining the direction of the comparison.
Severe Housing Problems County: Washoe
Severe Housing Problems County: Washoe
17.3%
(2016-2020)
Compared to:
NV Counties
The distribution is based on data from 17 locales.
U.S. Counties
The distribution is based on data from 3,141 U.S. counties and county equivalents.
NV Value
(18.8%)
The regional value is compared to the Nevada State value.
US Value
(16.7%)
The regional value is compared to the national value.
Prior Value
(17.2%)
Prior Value compares a measured value with the previously measured value. Confidence intervals were taken into account in determining the direction of the comparison.
Trend
This comparison measures the indicator’s values over multiple time periods.<br>The Mann-Kendall Test for Statistical Significance is used to evaluate the trend<br>over 4 to 10 periods of measure, subject to data availability and comparability.
Health / Respiratory Diseases
Adults with COPD County: Washoe
Adults with COPD County: Washoe
6.9%
Percent of adults
(2021)
Compared to:
NV Counties
The distribution is based on data from 17 locales.
U.S. Counties
The distribution is based on data from 3,074 U.S. counties and county equivalents.
US Value
(6.4%)
The regional value is compared to the national value.
Adults with Current Asthma County: Washoe
Adults with Current Asthma County: Washoe
9.8%
(2021)
Compared to:
NV Counties
The distribution is based on data from 17 locales.
U.S. Counties
The distribution is based on data from 3,074 U.S. counties and county equivalents.
US Value
(9.7%)
The regional value is compared to the national value.
Health / Respiratory Diseases
Age-Adjusted Death Rate due to Chronic Lower Respiratory Diseases
Value
Compared to:
Age-Adjusted Death Rate due to Chronic Lower Respiratory Diseases County: Washoe
Age-Adjusted Death Rate due to Chronic Lower Respiratory Diseases County: Washoe
43.9
Deaths per 100,000 population
(2018-2020)
Compared to:
U.S. Counties
The distribution is based on data from 2,518 U.S. counties and county equivalents.
NV Value
(47.1)
The regional value is compared to the Nevada State value.
US Value
(38.1)
The regional value is compared to the national value.
Prior Value
(47.3)
Prior Value compares a measured value with the previously measured value. Confidence intervals were taken into account in determining the direction of the comparison.
Trend
This comparison measures the indicator’s values over multiple time periods.<br>The Mann-Kendall Test for Statistical Significance is used to evaluate the trend<br>over 4 to 10 periods of measure, subject to data availability and comparability.
Asthma: Medicare Population County: Washoe
Asthma: Medicare Population County: Washoe
7.0%
(2022)
Compared to:
NV Counties
The distribution is based on data from 17 locales.
U.S. Counties
The distribution is based on data from 3,129 U.S. counties and county equivalents.
NV Value
(7.0%)
The regional value is compared to the Nevada State value.
US Value
(7.0%)
The regional value is compared to the national value.
Prior Value
(6.0%)
Prior Value compares a measured value with the previously measured value. Confidence intervals were not taken into account in determining the direction of the comparison.
Trend
This comparison measures the indicator’s values over multiple time periods.<br>The Mann-Kendall Test for Statistical Significance is used to evaluate the trend<br>over 4 to 10 periods of measure, subject to data availability and comparability.
COPD: Medicare Population County: Washoe
COPD: Medicare Population County: Washoe
9.0%
(2022)
Compared to:
NV Counties
The distribution is based on data from 17 locales.
U.S. Counties
The distribution is based on data from 3,129 U.S. counties and county equivalents.
NV Value
(11.0%)
The regional value is compared to the Nevada State value.
US Value
(11.0%)
The regional value is compared to the national value.
Prior Value
(9.0%)
Prior Value compares a measured value with the previously measured value. Confidence intervals were not taken into account in determining the direction of the comparison.
Trend
This comparison measures the indicator’s values over multiple time periods.<br>The Mann-Kendall Test for Statistical Significance is used to evaluate the trend<br>over 4 to 10 periods of measure, subject to data availability and comparability.
Proximity to Highways County: Washoe
Proximity to Highways County: Washoe
4.7%
(2020)
Compared to:
NV Counties
The distribution is based on data from 17 locales.
NV Value
(5.0%)
The regional value is compared to the Nevada State value.
Prior Value
(5.0%)
Prior Value compares a measured value with the previously measured value. Confidence intervals were not taken into account in determining the direction of the comparison.
Health / Sexually Transmitted Infections
Chlamydia Incidence Rate County: Washoe
Chlamydia Incidence Rate County: Washoe
497.0
Cases per 100,000 population
(2021)
Compared to:
NV Counties
The distribution is based on data from 17 locales.
U.S. Counties
The distribution is based on data from 2,800 U.S. counties and county equivalents.
NV Value
(520.0)
The regional value is compared to the Nevada State value.
US Value
(495.5)
The regional value is compared to the national value.
Prior Value
(535.9)
Prior Value compares a measured value with the previously measured value. Confidence intervals were not taken into account in determining the direction of the comparison.
Trend
This comparison measures the indicator’s values over multiple time periods.<br>The Mann-Kendall Test for Statistical Significance is used to evaluate the trend<br>over 4 to 10 periods of measure, subject to data availability and comparability.
Gonorrhea Incidence Rate County: Washoe
Gonorrhea Incidence Rate County: Washoe
213.6
Cases per 100,000 population
(2021)
Compared to:
NV Counties
The distribution is based on data from 17 locales.
U.S. Counties
The distribution is based on data from 3,117 U.S. counties and county equivalents.
NV Value
(270.0)
The regional value is compared to the Nevada State value.
US Value
(214.0)
The regional value is compared to the national value.
Prior Value
(238.6)
Prior Value compares a measured value with the previously measured value. Confidence intervals were not taken into account in determining the direction of the comparison.
Trend
This comparison measures the indicator’s values over multiple time periods.<br>The Mann-Kendall Test for Statistical Significance is used to evaluate the trend<br>over 4 to 10 periods of measure, subject to data availability and comparability.
Syphilis Incidence Rate County: Washoe
Syphilis Incidence Rate County: Washoe
32.2
Cases per 100,000 population
(2021)
Compared to:
NV Value
(29.9)
The regional value is compared to the Nevada State value.
US Value
(16.2)
The regional value is compared to the national value.
Prior Value
(28.2)
Prior Value compares a measured value with the previously measured value. Confidence intervals were not taken into account in determining the direction of the comparison.
Trend
This comparison measures the indicator’s values over multiple time periods.<br>The Mann-Kendall Test for Statistical Significance is used to evaluate the trend<br>over 4 to 10 periods of measure, subject to data availability and comparability.
Health / Tobacco Use
Adults Who Currently Use E-cigarettes County: Washoe
Adults Who Currently Use E-cigarettes County: Washoe
6.6%
(2017)
Compared to:
NV Value
(5.4%)
The regional value is compared to the Nevada State value.
US Value
(4.6%)
The regional value is compared to the national value.
Prior Value
(6.3%)
Prior Value compares a measured value with the previously measured value. Confidence intervals were not taken into account in determining the direction of the comparison.
Adults who Smoke County: Washoe
Adults who Smoke County: Washoe
13.3%
(2022)
Compared to:
NV Value
(14.8%)
The regional value is compared to the Nevada State value.
Prior Value
(15.8%)
Prior Value compares a measured value with the previously measured value. Confidence intervals were not taken into account in determining the direction of the comparison.
Trend
This comparison measures the indicator’s values over multiple time periods.<br>The Mann-Kendall Test for Statistical Significance is used to evaluate the trend<br>over 4 to 10 periods of measure, subject to data availability and comparability.
HP 2030 Target
(6.1%)
<div>TU-02: Reduce current cigarette smoking in adults <strong>(LEADING HEALTH INDICATOR)</strong></div>
Cigarette Spending-to-Income Ratio County: Washoe
Cigarette Spending-to-Income Ratio County: Washoe
1.8%
(2023)
Compared to:
NV Counties
The distribution is based on data from 17 locales.
U.S. Counties
The distribution is based on data from 3,141 U.S. counties and county equivalents.
NV Value
(2.1%)
The regional value is compared to the Nevada State value.
Prior Value
(1.8%)
Prior Value compares a measured value with the previously measured value. Confidence intervals were not taken into account in determining the direction of the comparison.
High School Students who Smoked Cigarettes: Past 30 Days County: Washoe
High School Students who Smoked Cigarettes: Past 30 Days County: Washoe
3.2%
(2021)
Compared to:
NV Value
(3.4%)
The regional value is compared to the Nevada State value.
Prior Value
(4.5%)
Prior Value compares a measured value with the previously measured value. Confidence intervals were taken into account in determining the direction of the comparison.
Trend
This comparison measures the indicator’s values over multiple time periods.<br>The Mann-Kendall Test for Statistical Significance is used to evaluate the trend<br>over 4 to 10 periods of measure, subject to data availability and comparability.
Middle School Students who Smoked Cigarettes: Past 30 Days County: Washoe
Middle School Students who Smoked Cigarettes: Past 30 Days County: Washoe
1.8%
(2021)
Compared to:
NV Value
(1.8%)
The regional value is compared to the Nevada State value.
Prior Value
(3.5%)
Prior Value compares a measured value with the previously measured value. Confidence intervals were not taken into account in determining the direction of the comparison.
Health / Weight Status
Adults 20+ Who Are Obese County: Washoe
Adults 20+ Who Are Obese County: Washoe
25.8%
(2021)
Compared to:
NV Counties
The distribution is based on data from 17 locales.
U.S. Counties
The distribution is based on data from 3,074 U.S. counties and county equivalents.
Prior Value
(25.5%)
Prior Value compares a measured value with the previously measured value. Confidence intervals were taken into account in determining the direction of the comparison.
Trend
This comparison measures the indicator’s values over multiple time periods.<br>The Mann-Kendall Test for Statistical Significance is used to evaluate the trend<br>over 4 to 10 periods of measure, subject to data availability and comparability.
HP 2030 Target
(36.0%)
Adults who are Overweight or Obese County: Washoe
Adults who are Overweight or Obese County: Washoe
66.3%
(2022)
Compared to:
NV Value
(67.3%)
The regional value is compared to the Nevada State value.
Prior Value
(64.3%)
Prior Value compares a measured value with the previously measured value. Confidence intervals were not taken into account in determining the direction of the comparison.
Trend
This comparison measures the indicator’s values over multiple time periods.<br>The Mann-Kendall Test for Statistical Significance is used to evaluate the trend<br>over 4 to 10 periods of measure, subject to data availability and comparability.
High School Students who are Obese County: Washoe
High School Students who are Obese County: Washoe
13.7%
(2021)
Compared to:
NV Value
(15.9%)
The regional value is compared to the Nevada State value.
Prior Value
(11.9%)
Prior Value compares a measured value with the previously measured value. Confidence intervals were taken into account in determining the direction of the comparison.
High School Students who are Overweight County: Washoe
High School Students who are Overweight County: Washoe
18.1%
(2021)
Compared to:
NV Value
(18.1%)
The regional value is compared to the Nevada State value.
Prior Value
(13.7%)
Prior Value compares a measured value with the previously measured value. Confidence intervals were taken into account in determining the direction of the comparison.
Health / Wellness & Lifestyle
Frequent Physical Distress County: Washoe
Frequent Physical Distress County: Washoe
12.2%
(2019)
Compared to:
NV Counties
The distribution is based on data from 17 locales.
U.S. Counties
The distribution is based on data from 3,121 U.S. counties and county equivalents.
NV Value
(13.4%)
The regional value is compared to the Nevada State value.
US Value
(12.0%)
The regional value is compared to the national value.
Prior Value
(12.7%)
Prior Value compares a measured value with the previously measured value. Confidence intervals were taken into account in determining the direction of the comparison.
Insufficient Sleep County: Washoe
Insufficient Sleep County: Washoe
33.1%
(2020)
Compared to:
NV Counties
The distribution is based on data from 17 locales.
U.S. Counties
The distribution is based on data from 3,140 U.S. counties and county equivalents.
NV Value
(35.3%)
The regional value is compared to the Nevada State value.
US Value
(33.0%)
The regional value is compared to the national value.
Prior Value
(35.2%)
Prior Value compares a measured value with the previously measured value. Confidence intervals were not taken into account in determining the direction of the comparison.
HP 2030 Target
(26.7%)
Poor Physical Health: 14+ Days County: Washoe
Poor Physical Health: 14+ Days County: Washoe
12.0%
(2021)
Compared to:
NV Counties
The distribution is based on data from 17 locales.
U.S. Counties
The distribution is based on data from 3,074 U.S. counties and county equivalents.
US Value
(10.9%)
The regional value is compared to the national value.
Poor Physical Health: Average Number of Days County: Washoe
Poor Physical Health: Average Number of Days County: Washoe
3.8
Days
(2021)
Compared to:
NV Counties
The distribution is based on data from 17 locales.
U.S. Counties
The distribution is based on data from 3,141 U.S. counties and county equivalents.
NV Value
(4.1)
The regional value is compared to the Nevada State value.
US Value
(3.3)
The regional value is compared to the national value.
Prior Value
(3.6)
Prior Value compares a measured value with the previously measured value. Confidence intervals were taken into account in determining the direction of the comparison.
Trend
This comparison measures the indicator’s values over multiple time periods.<br>The Mann-Kendall Test for Statistical Significance is used to evaluate the trend<br>over 4 to 10 periods of measure, subject to data availability and comparability.
Health / Wellness & Lifestyle
Self-Reported General Health Assessment: Poor or Fair
Value
Compared to:
Self-Reported General Health Assessment: Poor or Fair County: Washoe
Self-Reported General Health Assessment: Poor or Fair County: Washoe
16.5%
(2021)
Compared to:
NV Counties
The distribution is based on data from 17 locales.
U.S. Counties
The distribution is based on data from 3,074 U.S. counties and county equivalents.
US Value
(16.1%)
The regional value is compared to the national value.
